Experian 2011 Annual Report Download - page 143
Download and view the complete annual report
Please find page 143 of the 2011 Experian annual report below. You can navigate through the pages in the report by either clicking on the pages listed below, or by using the keyword search tool below to find specific information within the annual report.-
 1
1 -
2
-
3
-
4
-
5
-
6
-
7
-
8
-
9
-
10
-
11
-
12
-
13
-
14
-
15
-
16
-
17
-
18
-
19
-
20
-
21
-
22
-
23
-
24
-
25
-
26
-
27
-
28
-
29
-
30
-
31
-
32
-
33
-
34
-
35
-
36
-
37
-
38
-
39
-
40
-
41
-
42
-
43
-
44
-
45
-
46
-
47
-
48
-
49
-
50
-
51
-
52
-
53
-
54
-
55
-
56
-
57
-
58
-
59
-
60
-
61
-
62
-
63
-
64
-
65
-
66
-
67
-
68
-
69
-
70
-
71
-
72
-
73
-
74
-
75
-
76
-
77
-
78
-
79
-
80
-
81
-
82
-
83
-
84
-
85
-
86
-
87
-
88
-
89
-
90
-
91
-
92
-
93
-
94
-
95
-
96
-
97
-
98
-
99
-
100
-
101
-
102
-
103
-
104
-
105
-
106
-
107
-
108
-
109
-
110
-
111
-
112
-
113
-
114
-
115
-
116
-
117
-
118
-
119
-
120
-
121
-
122
-
123
-
124
-
125
-
126
-
127
-
128
-
129
-
130
-
131
-
132
-
 133
133 -
 134
134 -
 135
135 -
 136
136 -
 137
137 -
 138
138 -
 139
139 -
 140
140 -
 141
141 -
 142
142 -
 143
143 -
 144
144 -
 145
145 -
 146
146 -
 147
147 -
 148
148 -
 149
149 -
 150
150 -
 151
151 -
 152
152 -
 153
153 -
154
-
155
-
156
-
157
-
158
-
159
-
160
-
161
-
162
-
163
-
164
 |
 |

Financial statements 141
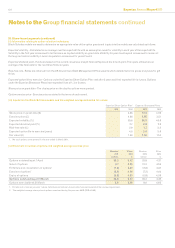
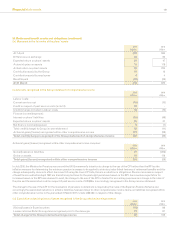
34. Retirement benet assets and obligations (continued)
(x) Historical information
2011
US$m
2010
US$m
2009
US$m
2008
US$m
2007
US$m
Fair value of plans' assets 913 822 595 1,045 1,069
Present value of dened benet obligations (858) (910) (653) (913) (984)
Net pension assets/(obligations) 55 (88) (58) 132 85
Experience adjustment on plans' assets - (gains)/losses (10) (178) 236 101 53
Experience adjustment on dened benet obligations - (gains)/losses (57) (1) 1 8 (5)
The Group’s retirement benet assets and obligations are denominated primarily in sterling.
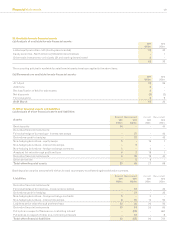
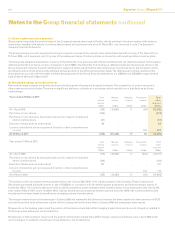
35. Deferred tax
(a) Net deferred tax liabilities 2011
US$m
2010
US$m
At 1 April 37 122
Differences on exchange 8 19
Charge/(credit) in the Group income statement (note 15) 64 (102)
Business combinations (note 40) 10 5
Tax recognised within other comprehensive income (note 16(a)) 30 3
Tax recognised in equity on transactions with owners (note 16(b)) (15) (8)
Transfer in respect of liabilities held for sale - (4)
Other transfers (13) 2
At 31 March 121 37
Net deferred tax liabilities are presented in the Group balance sheet as:
Deferred tax assets (159) (176)
Deferred tax liabilities 280 213
At 31 March 121 37
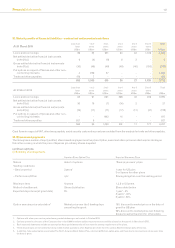
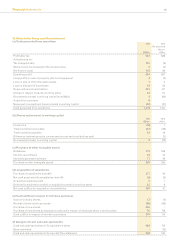
(b) Gross deferred tax assets
Movements in gross deferred tax assets, without taking into consideration the offsetting of assets and liabilities within the same tax
jurisdiction, comprise:
Accelerated
depreciation
US$m
Intangibles
US$m
Share
incentive
plans
US$m
Tax losses
US$m
Other
temporary
differences
US$m
Total
US$m
At 1 April 2010 20 62 39 118 158 397
Differences on exchange 1 - - - 8 9
Credit/(charge) in the Group income statement (13) (36) 2 8 15 (24)
Tax recognised within other comprehensive income - - - - (30) (30)
Tax recognised in equity on transactions with owners - - 15 - - 15
Other transfers - - - (9) 10 1
At 31 March 2011 8 26 56 117 161 368
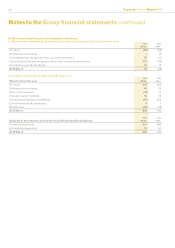
Accelerated
depreciation
US$m
Intangibles
US$m
Share
incentive
plans
US$m
Tax losses
US$m
Other
temporary
differences
US$m
Total
US$m
At 1 April 2009 22 63 22 17 144 268
Differences on exchange 1 3 - - 10 14
Credit/(charge) in the Group income statement (3) (4) 9 101 9 112
Tax recognised within other comprehensive income - - - - (3) (3)
Tax recognised in equity on transactions with owners - - 8 - - 8
Other transfers - - - - (2) (2)
At 31 March 2010 20 62 39 118 158 397