Experian 2011 Annual Report Download - page 138
Download and view the complete annual report
Please find page 138 of the 2011 Experian annual report below. You can navigate through the pages in the report by either clicking on the pages listed below, or by using the keyword search tool below to find specific information within the annual report.-
 1
1 -
2
-
3
-
4
-
5
-
6
-
7
-
8
-
9
-
10
-
11
-
12
-
13
-
14
-
15
-
16
-
17
-
18
-
19
-
20
-
21
-
22
-
23
-
24
-
25
-
26
-
27
-
28
-
29
-
30
-
31
-
32
-
33
-
34
-
35
-
36
-
37
-
38
-
39
-
40
-
41
-
42
-
43
-
44
-
45
-
46
-
47
-
48
-
49
-
50
-
51
-
52
-
53
-
54
-
55
-
56
-
57
-
58
-
59
-
60
-
61
-
62
-
63
-
64
-
65
-
66
-
67
-
68
-
69
-
70
-
71
-
72
-
73
-
74
-
75
-
76
-
77
-
78
-
79
-
80
-
81
-
82
-
83
-
84
-
85
-
86
-
87
-
88
-
89
-
90
-
91
-
92
-
93
-
94
-
95
-
96
-
97
-
98
-
99
-
100
-
101
-
102
-
103
-
104
-
105
-
106
-
107
-
108
-
109
-
110
-
111
-
112
-
113
-
114
-
115
-
116
-
117
-
118
-
119
-
120
-
121
-
122
-
123
-
124
-
125
-
126
-
127
-
 128
128 -
 129
129 -
 130
130 -
 131
131 -
 132
132 -
 133
133 -
 134
134 -
 135
135 -
 136
136 -
 137
137 -
 138
138 -
 139
139 -
 140
140 -
 141
141 -
 142
142 -
 143
143 -
 144
144 -
 145
145 -
 146
146 -
 147
147 -
 148
148 -
149
-
150
-
151
-
152
-
153
-
154
-
155
-
156
-
157
-
158
-
159
-
160
-
161
-
162
-
163
-
164
 |
 |

136 Experian Annual Report 2011
Notes to the Group nancial statements continued
33. Share-based payments (continued)
(ii) Information relating to share grant valuation techniques
Share grants are valued by reference to the market price on the day of award with no modications made for dividend distributions or other
factors as participants are entitled to dividend distributions on awarded shares. Market-based performance conditions are included in the fair
value measurement on grant date and are not revised for actual performance.
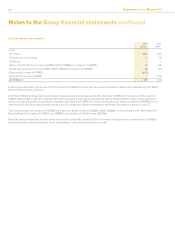
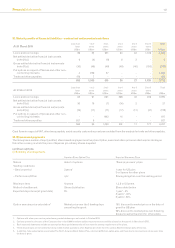
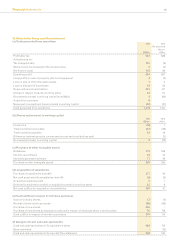
(iii) Movement in number of share awards outstanding 2011
million
2010
million
At 1 April 16.2 20.8
Grant of awards 9.4 4.4
Forfeiture of awards (1.0) (0.6)
Lapse of awards -(1.8)
Vesting of awards (3.7) (6.6)
At 31 March 20.9 16.2
Awards granted in the year had a weighted average fair value of £6.32 (2010: £4.65).
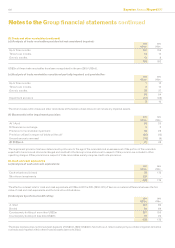
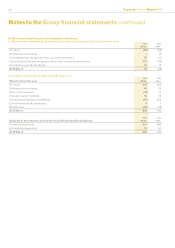
(c) Cost of share-based compensation 2011
US$m
2010
US$m
Share options 14 12
Share awards 50 46
Expense recognised (all equity settled) 64 58
Costs of associated social security obligations -5
Total expense recognised in Group income statement 64 63
Reported as follows:
Employee benet costs within Benchmark PBT 51 32
Charge in respect of demerger-related equity incentive plans (excluded from Benchmark PBT) 13 26
Expense recognised (all equity settled) 64 58
Costs of associated social security obligations (included in Benchmark PBT) -3
Costs of associated social security obligations (excluded from Benchmark PBT) -2
Total expense recognised in Group income statement 64 63
The costs of associated social security obligations include the costs of derivatives, in the form of equity swaps, entered into in connection with
such obligations.