Experian 2011 Annual Report Download - page 49
Download and view the complete annual report
Please find page 49 of the 2011 Experian annual report below. You can navigate through the pages in the report by either clicking on the pages listed below, or by using the keyword search tool below to find specific information within the annual report.-
 1
1 -
2
-
3
-
4
-
5
-
6
-
7
-
8
-
9
-
10
-
11
-
12
-
13
-
14
-
15
-
16
-
17
-
18
-
19
-
20
-
21
-
22
-
23
-
24
-
25
-
26
-
27
-
28
-
29
-
30
-
31
-
32
-
33
-
34
-
35
-
36
-
37
-
38
-
 39
39 -
 40
40 -
 41
41 -
 42
42 -
 43
43 -
 44
44 -
 45
45 -
 46
46 -
 47
47 -
 48
48 -
 49
49 -
 50
50 -
 51
51 -
 52
52 -
 53
53 -
 54
54 -
 55
55 -
 56
56 -
 57
57 -
 58
58 -
 59
59 -
60
-
61
-
62
-
63
-
64
-
65
-
66
-
67
-
68
-
69
-
70
-
71
-
72
-
73
-
74
-
75
-
76
-
77
-
78
-
79
-
80
-
81
-
82
-
83
-
84
-
85
-
86
-
87
-
88
-
89
-
90
-
91
-
92
-
93
-
94
-
95
-
96
-
97
-
98
-
99
-
100
-
101
-
102
-
103
-
104
-
105
-
106
-
107
-
108
-
109
-
110
-
111
-
112
-
113
-
114
-
115
-
116
-
117
-
118
-
119
-
120
-
121
-
122
-
123
-
124
-
125
-
126
-
127
-
128
-
129
-
130
-
131
-
132
-
133
-
134
-
135
-
136
-
137
-
138
-
139
-
140
-
141
-
142
-
143
-
144
-
145
-
146
-
147
-
148
-
149
-
150
-
151
-
152
-
153
-
154
-
155
-
156
-
157
-
158
-
159
-
160
-
161
-
162
-
163
-
164
 |
 |
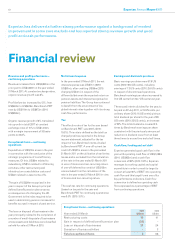
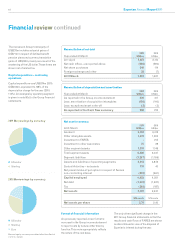
Business review Financial review 47
Use of non-GAAP financial information
Experian has identified certain measures
that it believes will assist understanding
of the performance of the Group. As these
measures are not defined under IFRS, they
may not be directly comparable with other
companies’ adjusted measures.
The non-GAAP measures are not intended
to be a substitute for, or superior to,
any IFRS measures of performance but
management has included them as these
are considered to be important comparables
and key measures used within the business
for assessing performance.
Such non-GAAP measures that are
included within the Group financial
statements are detailed in note 7 to those
financial statements. Further non-GAAP
measures and reconciliations of those
measures are set out below.
Earnings before interest, tax, depreciation
and amortisation (‘EBITDA’): EBITDA
is defined as profit before amortisation
of acquisition intangibles, acquisition
expenses, goodwill impairments,
adjustments to contingent consideration,
charges in respect of the demerger-related
equity incentive plans, exceptional items,
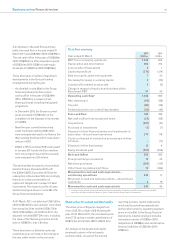
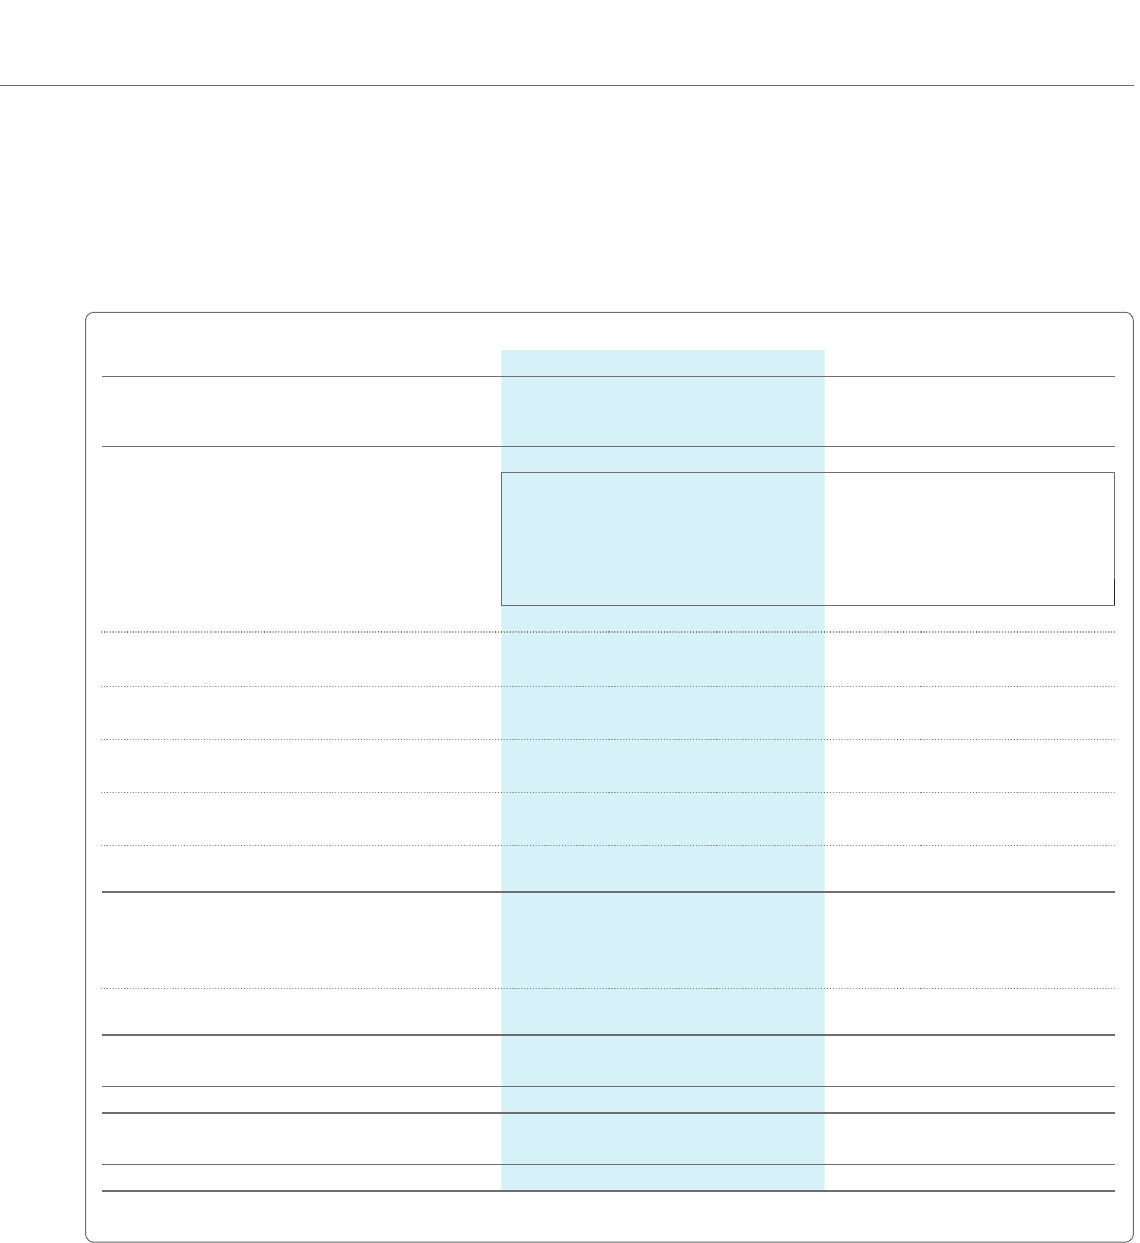
Income statement analysis – continuing operations
2011 2010
Benchmark Non-
benchmark1
Total Benchmark Non-
benchmark1
Total
Year ended 31 March US$m US$m US$m US$m US$m US$m
Revenue 4,239 - 4,239 3,880 - 3,880
Labour costs (1,535) 10 (1,525) (1,465) (49) (1,514)
Data and information technology costs (316) (1) (317) (317) (2) (319)
Depreciation and amortisation (288) (132) (420) (274) (143) (417)
Marketing and customer acquisition costs (594) - (594) (489) - (489)
Other operating charges (460) (29) (489) (402) (42) (444)
Total operating expenses (3,193) (152) (3,345) (2,947) (236) (3,183)
Operating profit/(loss) 1,046 (152) 894 933 (236) 697
Share of (losses)/profits of associates (2) - (2) 2- 2
EBIT from continuing operations 1,044 935
Non-benchmark items (152) (236)
Profit/(loss) before net finance costs and tax 1,044 (152) 892 935 (236) 699
Net finance costs (71) (142) (213) (81) (18) (99)
Profit/(loss) before tax 973 (294) 679 854 (254) 600
Tax (220) 91 (129) (162) 171 9
Profit/(loss) after tax for the year from
continuing operations 753 (203) 550 692 (83) 609
Attributable to:
Owners of Experian plc 701 (193) 508 647 (74) 573
Non-controlling interests 52 (10) 42 45 (9) 36
Profit/(loss) after tax for the year from
continuing operations 753 (203) 550 692 (83) 609
US cents US cents US cents US cents US cents US cents
Earnings/(loss) per share – basic 70.0 (19.4) 50.6 63.7 (7.3) 56.4
%%%% % %
Effective rate of tax 22.6 31.0 19.0 19.0 67.3 (1.5)
1. These include charges for exceptional items of US$2m (2010: US$68m) and total adjustments to Benchmark PBT of US$292m (2010: US$186m), full details of which are included in note 13 to
the Group financial statements.
net finance costs, tax, depreciation and
other amortisation. It includes the Group’s
share of continuing associates’ pre-tax
results.
Discontinuing activities: Experian defines
discontinuing activities as businesses
sold, closed or identified for closure during
a financial year. These are treated as
discontinuing activities for both revenue
and EBIT purposes. Prior periods, where
shown, are restated to disclose separately
the results of discontinuing activities.
This financial measure differs from the
definition of discontinued operations set