Experian 2011 Annual Report Download - page 130
Download and view the complete annual report
Please find page 130 of the 2011 Experian annual report below. You can navigate through the pages in the report by either clicking on the pages listed below, or by using the keyword search tool below to find specific information within the annual report.-
 1
1 -
2
-
3
-
4
-
5
-
6
-
7
-
8
-
9
-
10
-
11
-
12
-
13
-
14
-
15
-
16
-
17
-
18
-
19
-
20
-
21
-
22
-
23
-
24
-
25
-
26
-
27
-
28
-
29
-
30
-
31
-
32
-
33
-
34
-
35
-
36
-
37
-
38
-
39
-
40
-
41
-
42
-
43
-
44
-
45
-
46
-
47
-
48
-
49
-
50
-
51
-
52
-
53
-
54
-
55
-
56
-
57
-
58
-
59
-
60
-
61
-
62
-
63
-
64
-
65
-
66
-
67
-
68
-
69
-
70
-
71
-
72
-
73
-
74
-
75
-
76
-
77
-
78
-
79
-
80
-
81
-
82
-
83
-
84
-
85
-
86
-
87
-
88
-
89
-
90
-
91
-
92
-
93
-
94
-
95
-
96
-
97
-
98
-
99
-
100
-
101
-
102
-
103
-
104
-
105
-
106
-
107
-
108
-
109
-
110
-
111
-
112
-
113
-
114
-
115
-
116
-
117
-
118
-
119
-
 120
120 -
 121
121 -
 122
122 -
 123
123 -
 124
124 -
 125
125 -
 126
126 -
 127
127 -
 128
128 -
 129
129 -
 130
130 -
 131
131 -
 132
132 -
 133
133 -
 134
134 -
 135
135 -
 136
136 -
 137
137 -
 138
138 -
 139
139 -
 140
140 -
141
-
142
-
143
-
144
-
145
-
146
-
147
-
148
-
149
-
150
-
151
-
152
-
153
-
154
-
155
-
156
-
157
-
158
-
159
-
160
-
161
-
162
-
163
-
164
 |
 |

128 Experian Annual Report 2011
Notes to the Group nancial statements continued
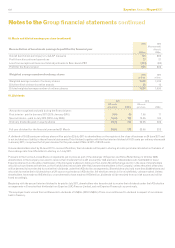
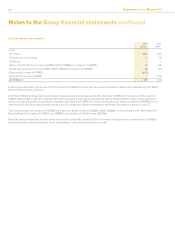
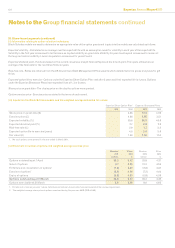
25. Trade and other receivables (continued)
(d) Analysis of trade receivables past due but not considered impaired: 2011
US$m
2010
US$m
Up to three months 167 159
Three to six months 14 15
Over six months 13 8
194 182
US$2m of these trade receivables have been renegotiated in the year (2010: US$nil).
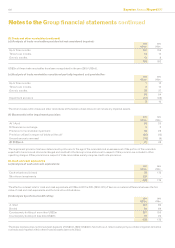
(e) Analysis of trade receivables considered partially impaired and provided for: 2011
US$m
2010
US$m
Up to three months 712
Three to six months 815
Over six months 38 27
53 54
Impairment provision (47) (38)
6 16
The other classes within trade and other receivables at the balance sheet dates do not include any impaired assets.
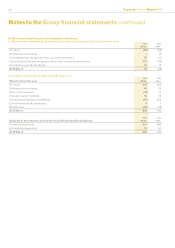
(f) Movements in the impairment provision: 2011
US$m
2010
US$m
At 1 April 38 25
Differences on exchange 52
Provision for receivables impairment 34 29
Provision utilised in respect of debts written off (20) (12)
Unused amounts reversed (10) (6)
At 31 March 47 38
The impairment provision has been determined by reference to the age of the receivable and an assessment of the portion of the receivable
expected to be recovered. Amounts charged and credited to the Group income statement in respect of this provision are included in other
operating charges. Other provisions in respect of trade receivables mainly comprise credit note provisions.
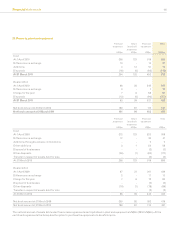
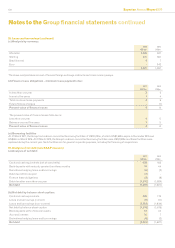
26. Cash and cash equivalents
(a) Analysis of cash and cash equivalents: 2011
US$m
2010
US$m
Cash at bank and in hand 78 175
Short-term investments 330 -
408 175
The effective interest rate for cash and cash equivalents at 31 March 2011 is 2.8% (2010: 4.8%). There is no material difference between the fair
value of cash and cash equivalents and the book value stated above.
(b) Analysis by external credit rating: 2011
US$m
2010
US$m
A rated 327 86
B rated 60 69
Counterparty holding of more than US$2m 387 155
Counterparty holding of less than US$2m 21 20
408 175
The above analysis does not include bank deposits of US$14m (2010: US$44m) held with an A rated counterparty as collateral against derivative
contracts and reported within other nancial assets (see note 31(a)).