Volvo 2005 Annual Report Download - page 98
Download and view the complete annual report
Please find page 98 of the 2005 Volvo annual report below. You can navigate through the pages in the report by either clicking on the pages listed below, or by using the keyword search tool below to find specific information within the annual report.-
 1
1 -
2
-
3
-
4
-
5
-
6
-
7
-
8
-
9
-
10
-
11
-
12
-
13
-
14
-
15
-
16
-
17
-
18
-
19
-
20
-
21
-
22
-
23
-
24
-
25
-
26
-
27
-
28
-
29
-
30
-
31
-
32
-
33
-
34
-
35
-
36
-
37
-
38
-
39
-
40
-
41
-
42
-
43
-
44
-
45
-
46
-
47
-
48
-
49
-
50
-
51
-
52
-
53
-
54
-
55
-
56
-
57
-
58
-
59
-
60
-
61
-
62
-
63
-
64
-
65
-
66
-
67
-
68
-
69
-
70
-
71
-
72
-
73
-
74
-
75
-
76
-
77
-
78
-
79
-
80
-
81
-
82
-
83
-
84
-
85
-
86
-
87
-
 88
88 -
 89
89 -
 90
90 -
 91
91 -
 92
92 -
 93
93 -
 94
94 -
 95
95 -
 96
96 -
 97
97 -
 98
98 -
 99
99 -
 100
100 -
 101
101 -
 102
102 -
 103
103 -
 104
104 -
 105
105 -
 106
106 -
 107
107 -
 108
108 -
109
-
110
-
111
-
112
-
113
-
114
-
115
-
116
-
117
-
118
-
119
-
120
-
121
-
122
-
123
-
124
-
125
-
126
-
127
-
128
-
129
-
130
-
131
-
132
-
133
-
134
-
135
-
136
-
137
-
138
-
139
-
140
-
141
-
142
-
143
-
144
-
145
-
146
-
147
-
148
-
149
-
150
-
151
-
152
-
153
-
154
-
155
-
156
-
157
-
158
-
159
-
160
-
161
-
162
 |
 |

The Volvo Group
94 Volvo Group 2005
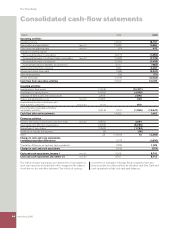
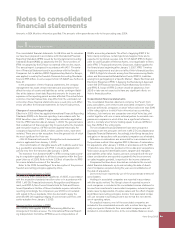
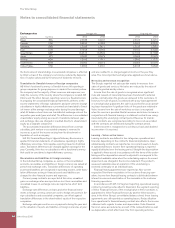
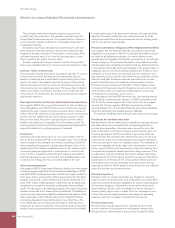
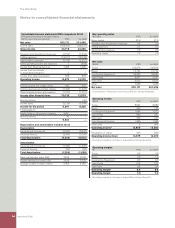
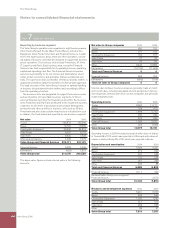
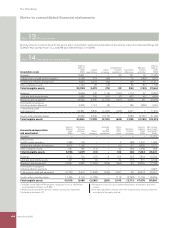
Notes to consolidated fi nancial statements
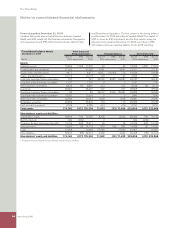
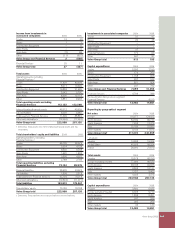
Consolidated balance sheets Volvo Group excl
December 31, 2004 Financial Services
1 Financial Services Volvo Group total
Dec 31 IFRS Dec 31 Dec 31 IFRS Dec 31 Dec 31 IFRS Dec 31
SEK M 2004 adjustments 2004 2004 adjustments 2004 2004 adjustments 2004
Assets
Intangible assets 16,564 1,006 17,570 42 42 16,606 1,006 17,612
Property, plant and equipment 27,260 27,260 3,891 3,891 31,151 31,151
Assets under operating leases 8,477 8,477 12,817 (12,044) 773 19,534 19,534
Shares and participations 10,116 10,116 193 193 2,003 2,003
Long-term customer fi nance receivables 147 147 25,200 8,687 33,887 25,187 25,187
Long-term interest-bearing receivables 1,797 1,797 5 5 1,741 1,741
Other long-term receivables 6,426 66 6,492 212 212 6,034 66 6,100
Inventories 28,291 28,291 307 307 28,598 28,598
Short-term customer fi nance receivables 83 83 26,207 3,324 29,531 26,006 26,006
Short-term interest bearing receivables 10,330 10,330 0 0 1,643 1,643
Other short-term receivables 30,043 30,043 1,628 1,628 29,647 29,647
Marketable securities 25,839 25,839 116 116 25,955 25,955
Cash and cash equivalent 8,789 8,789 914 914 8,791 8,791
Total assets 174,162 1,072 175,234 71,532 (33) 71,499 222,896 1,072 223,968
Shareholders’ equity and liabilities
Shareholders’ equity 69,409 746 70,155 8,306 8,306 69,409 746 70,155
Minority interests 229 (229) – 0 – 229 (229)
Provisions for post-employment benefi ts 14,129 548 14,677 26 26 14,155 548 14,703
Other provisions 14,020 95 14,115 878 (33) 845 14,898 95 14,993
Loans 13,968 13,968 57,860 57,860 61,807 61,807
Other liabilities 62,407 (88) 62,319 4,462 4,462 62,398 (88) 62,310
Shareholders’ equity and liabilities 174,162 1,072 175,234 71,532 (33) 71,499 222,896 1,072 223,968
1 Financial Services reported in accordance with the equity method.
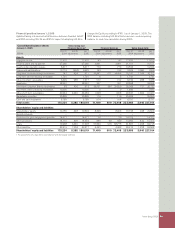
Financial position December 31, 2004
Updated, taking into account, all differences between Swedish
GAAP and IFRS except IAS 39 Financial instruments: Recognition
and measurement and IFRS 5, Non-Current Assets Held for Sale
and Discontinued Operations. The fi rst column is the closing balance
per December 31, 2004 according to Swedish GAAP. The impact of
IFRS is shown as IFRS adjustment and the third column shows the
adjusted closing balance December 31, 2004, according to IFRS.
This balance has been opening balance for the 2005 reporting.