Volvo 2005 Annual Report Download - page 156
Download and view the complete annual report
Please find page 156 of the 2005 Volvo annual report below. You can navigate through the pages in the report by either clicking on the pages listed below, or by using the keyword search tool below to find specific information within the annual report.-
 1
1 -
2
-
3
-
4
-
5
-
6
-
7
-
8
-
9
-
10
-
11
-
12
-
13
-
14
-
15
-
16
-
17
-
18
-
19
-
20
-
21
-
22
-
23
-
24
-
25
-
26
-
27
-
28
-
29
-
30
-
31
-
32
-
33
-
34
-
35
-
36
-
37
-
38
-
39
-
40
-
41
-
42
-
43
-
44
-
45
-
46
-
47
-
48
-
49
-
50
-
51
-
52
-
53
-
54
-
55
-
56
-
57
-
58
-
59
-
60
-
61
-
62
-
63
-
64
-
65
-
66
-
67
-
68
-
69
-
70
-
71
-
72
-
73
-
74
-
75
-
76
-
77
-
78
-
79
-
80
-
81
-
82
-
83
-
84
-
85
-
86
-
87
-
88
-
89
-
90
-
91
-
92
-
93
-
94
-
95
-
96
-
97
-
98
-
99
-
100
-
101
-
102
-
103
-
104
-
105
-
106
-
107
-
108
-
109
-
110
-
111
-
112
-
113
-
114
-
115
-
116
-
117
-
118
-
119
-
120
-
121
-
122
-
123
-
124
-
125
-
126
-
127
-
128
-
129
-
130
-
131
-
132
-
133
-
134
-
135
-
136
-
137
-
138
-
139
-
140
-
141
-
142
-
143
-
144
-
145
-
 146
146 -
 147
147 -
 148
148 -
 149
149 -
 150
150 -
 151
151 -
 152
152 -
 153
153 -
 154
154 -
 155
155 -
 156
156 -
 157
157 -
 158
158 -
 159
159 -
 160
160 -
 161
161 -
 162
162
 |
 |
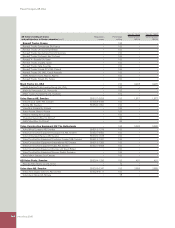
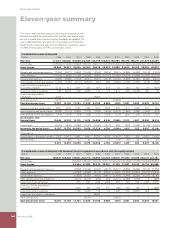
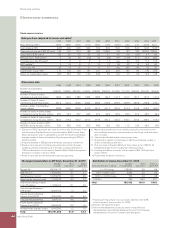
Eleven-year summary
152 Volvo Group 2005
Operating income
SEK M 1995
8 1996
7 1997
6 1998
5 1999
4 2000 2001
3 2002 2003
2 2004
1 2005
Trucks
9 5,020 783 1,707 2,769 3,247 1,414 (2,066) 1,189 3,951 8,992 11,717
Buses 405 331 550 (37) 224 440 (916) (94) (790) 158 470
Construction Equipment 717 1,162 1,436 626 1,709 1,594 527 406 908 1,898 2,752
Volvo Penta 212 (27) 181 (63) 314 484 658 647 695 940 943
Volvo Aero 103 153 472 527 584 621 653 5 (44) 403 836
Financial Services 355 244 375 681 1,066 1,499 325 490 926 1,365 2,033
Other 1,422 9,377 3,624 3,950 319 616 143 194 (3,142) 923 (600)
Volvo Group excluding
divested operations 8,234 12,023 8,345 8,453 7,463 6,668 (676) 2,837 2,504 14,679 18,151
Cars 490 1,080 4,409 3,375 26,695 – – – – – –
Other divested operations 4,563 91 – – – – – – – – –
Operating income (loss)
Volvo Group 13,287 13,194 12,754 11,828 34,158 6,668 (676) 2,837 2,504 14,679 18,151
1 Operating income in 2004 included reversal of write-down of shares in
Scania AB of 915, reported in Other, and write-down of shares in Henlys
Group Plc of 95, reported in Buses.
2 Operating income in 2003 included write-down of shares in Scania AB and
Henlys Group Plc amounting to 4,030, of which 429 was reported in Buses
(Henlys Group) and 3,601 was reported in Other (Scania AB).
3 Operating income in 2001 included restructuring costs mainly related to
the integration of Mack Trucks and Renault Trucks of 3,862 of which 3,106
in Trucks, 392 in Buses and 364 in Construction Equipment.
4 Effective January 1, 1999, Volvo Cars was reported as a divested opera-
tion. The capital gain from the divestment was 26,695.
5 Restructuring costs in 1998 amounted to 1,650 of which 46 in Trucks, 422
in Buses, 910 in Construction Equipment and 158 in Volvo Penta. In addi-
tion operating income included a capital gain from the sale of shares in
Pharmacia UpJohn amounting to 4,452.
6 Operating income in 1997 included a capital gain from the sale of shares in
Pripps Ringnes amounting to 3,027.
7 Operating income in 1996 included a capital gain from the sale of shares
in Pharmacia UpJohn amounting to 7,766.
8 Operating income in 1995 included write-down of goodwill pertaining to
Volvo Construction Equipment, consolidated as from July 1, 1995, amount-
ing to 1,817.
9 Refers to Volvo Trucks for 1995–2000.
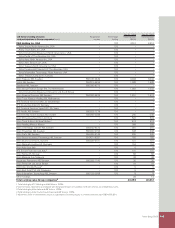
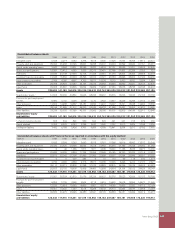
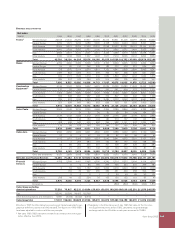
Operating margin
% 1995
1996 1997 1998
1999 2000 2001
2002 2003
2004 2005
Trucks 11.0 2.0 3.8 5.0 5.4 2.4 (1.8) 1.0 3.4 6.6 7.5
Buses 5.3 3.9 5.2 (0.3) 1.5 2.6 (5.5) (0.7) (6.6) 1.2 2.8
Construction Equipment
1 10.4 9.1 8.6 3.2 9.1 8.0 2.5 1.9 3.9 6.5 7.9
Volvo Penta 5.5 (0.7) 4.1 (1.3) 5.5 7.3 8.9 8.4 9.1 10.4 9.6
Volvo Aero 2.7 3.7 6.3 6.1 5.9 5.8 5.5 0.1 (0.5) 5.8 11.1
Volvo Group excluding
divested operations 11.4 17.1 9.6 7.9 6.4 5.5 (0.4) 1.6 1.4 7.3 7.9
Operating margin, total 8.0 8.8 7.1 5.7 29.3 5.5 (0.4) 1.6 1.4 7.3 7.9
1 Included in the Volvo Group as of mid-year 1995. Operating margin for Volvo Construction Equipment for 1995 amounted to 12.3.
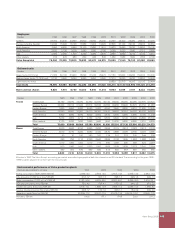
Number of employees at year-end
Number 1995
1996 1997 1998
1999 2000 2001
2002 2003
2004 2005
Trucks 21,450 20,860 22,090 22,560 23,330 24,320 44,180 43,470 46,900 49,450 50,240
Buses 3,620 3,750 4,220 8,690 8,860 9,060 6,230 6,660 6,680 7,700 7,710
Construction Equipment 7,610 7,300 8,550 9,680 8,900 8,830 7,780 8,410 9,280 9,930 10,290
Volvo Penta 1,570 1,420 1,400 1,490 1,400 1,480 1,370 1,410 1,440 1,580 1,560
Volvo Aero 3,890 3,740 4,170 3,990 4,550 4,240 4,040 3,660 3,440 3,350 3,460
Financial Services 450 560 710 860 1,160 1,220 1,080 1,060 1,060 1,100 1,070
Other 2,370 3,090 3,840 5,190 5,270 5,120 6,240 6,490 6,940 7,970 7,530
Volvo Group, excluding
divested operations 40,960 40,720 44,980 52,460 53,470 54,270 70,920 71,160 75,740 81,080 81,860
Cars 31,050 29,600 27,920 27,360 – – – – – – –
Other divested operations 7,040 10 – – – – – – – – –
Volvo Group, total 79,050 70,330 72,900 79,820 53,470 54,270 70,920 71,160 75,740 81,080 81,860
Eleven-year summary