Volvo 2005 Annual Report Download - page 150
Download and view the complete annual report
Please find page 150 of the 2005 Volvo annual report below. You can navigate through the pages in the report by either clicking on the pages listed below, or by using the keyword search tool below to find specific information within the annual report.-
 1
1 -
2
-
3
-
4
-
5
-
6
-
7
-
8
-
9
-
10
-
11
-
12
-
13
-
14
-
15
-
16
-
17
-
18
-
19
-
20
-
21
-
22
-
23
-
24
-
25
-
26
-
27
-
28
-
29
-
30
-
31
-
32
-
33
-
34
-
35
-
36
-
37
-
38
-
39
-
40
-
41
-
42
-
43
-
44
-
45
-
46
-
47
-
48
-
49
-
50
-
51
-
52
-
53
-
54
-
55
-
56
-
57
-
58
-
59
-
60
-
61
-
62
-
63
-
64
-
65
-
66
-
67
-
68
-
69
-
70
-
71
-
72
-
73
-
74
-
75
-
76
-
77
-
78
-
79
-
80
-
81
-
82
-
83
-
84
-
85
-
86
-
87
-
88
-
89
-
90
-
91
-
92
-
93
-
94
-
95
-
96
-
97
-
98
-
99
-
100
-
101
-
102
-
103
-
104
-
105
-
106
-
107
-
108
-
109
-
110
-
111
-
112
-
113
-
114
-
115
-
116
-
117
-
118
-
119
-
120
-
121
-
122
-
123
-
124
-
125
-
126
-
127
-
128
-
129
-
130
-
131
-
132
-
133
-
134
-
135
-
136
-
137
-
138
-
139
-
 140
140 -
 141
141 -
 142
142 -
 143
143 -
 144
144 -
 145
145 -
 146
146 -
 147
147 -
 148
148 -
 149
149 -
 150
150 -
 151
151 -
 152
152 -
 153
153 -
 154
154 -
 155
155 -
 156
156 -
 157
157 -
 158
158 -
 159
159 -
 160
160 -
161
-
162
 |
 |

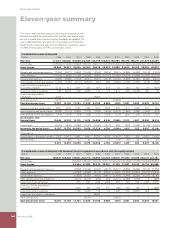
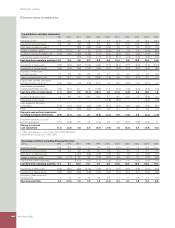
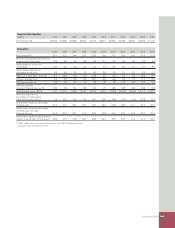
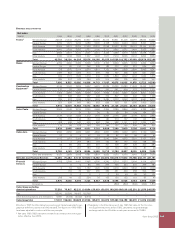
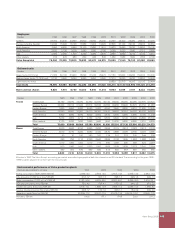
Eleven-year summary
146 Volvo Group 2005
Consolidated income statements
SEK M 1995 1996 1997 1998 1999 2000 2001 2002 2003 2004 2005
Net sales 171,511 156,060 183,625 212,936 125,019 130,070 189,280 186,198 183,291 211,076 240,559
Cost of sales (128,529) (121,249) (138,990) (163,876) (99,501) (104,548) (155,592) (151,569) (146,879) (164,170) (186,662)
Gross income 42,982 34,811 44,635 49,060 25,518 25,522 33,688 34,629 36,412 46,906 53,897
Research and development expenses (7,343) (8,271) (8,659) (10,104) (4,525) (4,876) (5,391) (5,869) (6,829) (7,614) (7,557)
Selling expenses (17,418) (14,895) (17,160) (19,042) (8,865) (10,140) (15,766) (16,604) (16,866) (19,369) (20,778)
Administrative expenses (7,399) (6,685) (7,018) (8,091) (4,791) (4,974) (6,709) (5,658) (5,467) (5,483) (6,301)
Other operating income and expenses (1,657) (1,087) (3,141) (2,634) (611) 622 (4,096) (4,152) (1,367) (618) (590)
Income (loss) from investments in
associated companies 2,119 314 2,929 444 567 444 50 182 200 27 (557)
Income from other investments 788 9,007 1,168 4,526 170 70 1,410 309 (3,579) 830 37
Income from divestment of
subsidiaries 3,032 – – – 26,695 – – – – – –
Restructuring costs (1,817) – – (2,331) – – (3,862) – – –
Operating income (loss) 13,287 13,194 12,754 11,828 34,158 6,668 (676) 2,837 2,504 14,679 18,151
Interest income and similar credits 3,801 4,530 3,197 1,268 1,812 1,588 1,275 1,217 1,096 821 654
Interest expenses and similar charges (3,686) (3,114) (2,699) (1,315) (1,505) (1,845) (2,274) (1,840) (1,888) (1,254) (972)
Other fi nancial income and expenses (354) (407) (76) (162) 131 (165) (191) (201) (55) (1,210) 181
Income (loss) after
fi nancial items 13,048 14,203 13,176 11,619 34,596 6,246 (1,866) 2,013 1,657 13,036 18,014
Income taxes (3,741) (1,825) (2,583) (3,140) (2,270) (1,510) 326 (590) (1,334) (3,129) (4,908)
Income for the period (loss) 9,307 12,378 10,593 8,479 32,326 4,736 (1,540) 1,423 323 9,907 13,106
Attributable to
Equity holders of the parent company 9,262 12,477 10,481 8,437 32,222 4,709 (1,467) 1,393 298 9,867 13,052
Minority interest 45 (99) 112 42 104 27 (73) 30 25 40 54
9,307 12,378 10,593 8,479 32,326 4,736 (1,540) 1,423 323 9,907 13,106
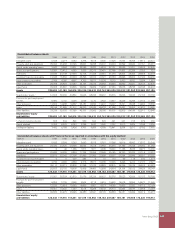
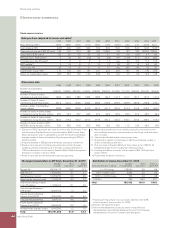
Consolidated income statements with Financial Services reported in accordance with the equity method
SEK M 1995 1996 1997 1998 1999 2000 2001 2002 2003 2004 2005
Net sales 166,541 150,425 178,531 205,712 116,382 120,392 180,615 177,080 174,768 202,171 231,191
Cost of sales (135,027) (158,077) (92,772) (97,131) (149,477) (145,453) (141,256) (158,453) (180,823)
Gross income 43,504 47,635 23,610 23,261 31,138 31,627 33,512 43,718 50,368
Research and development expenses (8,659) (10,104) (4,525) (4,876) (5,391) (5,869) (6,829) (7,614) (7,557)
Selling expenses (16,763) (18,468) (8,117) (9,285) (14,663) (15,393) (15,891) (18,317) (19,616)
Administrative expenses (6,889) (7,950) (4,632) (4,651) (6,474) (5,464) (5,259) (5,310) (6,147)
Other operating income and expenses (3,015) (2,515) (587) 309 (3,071) (2,989) (540) 7 (399)
Income from Financial Services 375 681 1,066 1,499 325 490 926 1,365 2,033
Income (loss) from investments in
associated companies 3,033 354 478 341 (86) 126 166 2 (568)
Income from other investments 1,168 4,526 170 70 1,408 309 (3,581) 828 37
Income from divestment of subsidiaries – – 26,695 – – – – – –
Restructuring costs – (2,331) – – (3,862) – – – –
Operating income (loss) 13,287 13,194 12,754 11,828 34,158 6,668 (676) 2,837 2,504 14,679 18,151
Eleven-year summary
The eleven-year summary presents each year in accordance with
General Accepted Accounting Practice for that year. Earlier years
are not restated when new accounting standards are applied. The
years 1995-2003 are accounted for in accordance with Swedish
GAAP for the respective year. As from 2004 the reporting is based
on IFRS. The transition to IFRS is desribed in note 3.