Volvo 2005 Annual Report Download - page 53
Download and view the complete annual report
Please find page 53 of the 2005 Volvo annual report below. You can navigate through the pages in the report by either clicking on the pages listed below, or by using the keyword search tool below to find specific information within the annual report.-
 1
1 -
2
-
3
-
4
-
5
-
6
-
7
-
8
-
9
-
10
-
11
-
12
-
13
-
14
-
15
-
16
-
17
-
18
-
19
-
20
-
21
-
22
-
23
-
24
-
25
-
26
-
27
-
28
-
29
-
30
-
31
-
32
-
33
-
34
-
35
-
36
-
37
-
38
-
39
-
40
-
41
-
42
-
 43
43 -
 44
44 -
 45
45 -
 46
46 -
 47
47 -
 48
48 -
 49
49 -
 50
50 -
 51
51 -
 52
52 -
 53
53 -
 54
54 -
 55
55 -
 56
56 -
 57
57 -
 58
58 -
 59
59 -
 60
60 -
 61
61 -
 62
62 -
 63
63 -
64
-
65
-
66
-
67
-
68
-
69
-
70
-
71
-
72
-
73
-
74
-
75
-
76
-
77
-
78
-
79
-
80
-
81
-
82
-
83
-
84
-
85
-
86
-
87
-
88
-
89
-
90
-
91
-
92
-
93
-
94
-
95
-
96
-
97
-
98
-
99
-
100
-
101
-
102
-
103
-
104
-
105
-
106
-
107
-
108
-
109
-
110
-
111
-
112
-
113
-
114
-
115
-
116
-
117
-
118
-
119
-
120
-
121
-
122
-
123
-
124
-
125
-
126
-
127
-
128
-
129
-
130
-
131
-
132
-
133
-
134
-
135
-
136
-
137
-
138
-
139
-
140
-
141
-
142
-
143
-
144
-
145
-
146
-
147
-
148
-
149
-
150
-
151
-
152
-
153
-
154
-
155
-
156
-
157
-
158
-
159
-
160
-
161
-
162
 |
 |
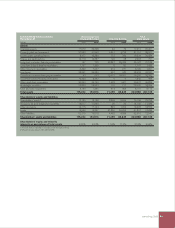
Volvo Group 2005 49
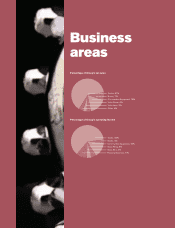
Operating margin
% 2004 2005
Trucks 6.6 7.5
Buses 2.0 2.8
Construction Equipment 6.5 7.9
Volvo Penta 10.4 9.6
Volvo Aero 5.8 11.1
Volvo Group1 6.9 7.9
Volvo Group 7.3 7.9
1 Excluding revaluation of shares in Scania AB and
Henlys Group Plc.
Consolidated income statements 1
SEK M 2004 2005
Net sales 202,171 231,191
Cost of sales (158,453) (180,823)
Gross income 43,718 50,368
Research and development expenses (7,614) (7,557)
Selling expenses (18,317) (19,616)
Administrative expenses (5,310) (6,147)
Other operating income and expenses 7 (399)
Income from Financial Services 1 1,365 2,033
Income from investments in associated companies 2 (568)
Income from other investments 828 37
Operating income 14,679 18,151
Interest income and similar credits 993 816
Interest expenses and similar charges (1,426) (1,134)
Other financial income and expenses 2 (1,210) 181
Income after financial expenses 13,036 18,014
Income taxes (3,129) (4,908)
Income for the period 3 9,907 13,106
3 Attributable to:
Equity holders of the parent company 9,867 13,052
Minority 40 54
9,907 13,106
Earnings per share, SEK 23.58 32.21
1 Financial Services reported in accordance with the equity method.
2 2004 includes a write-down relating to the holding in Henlys Group Plc of SEK 1,196 M.
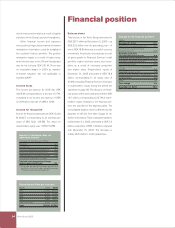
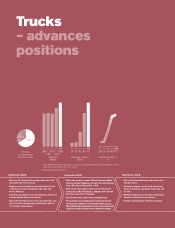
Change in operating income
SEK bn
Operating income 2004 14.7
Higher volumes and improvement
of gross margins 5.4
Higher income from Financial Services 0.7
Changes in currency exchange rates 0.1
Higher capitalization of development
costs 1.3
Higher research and development
expenditures (1.1)
Higher selling and administrative
expenses (2.0)
Revaluation of shares in Scania AB
and Henlys Group, 2004 (0.8)
Other (0.1)
Operating income 2005 18.2
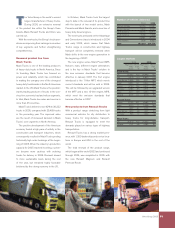
Volvo Penta maintained its high profitability
during 2005 and at the same time imple-
mented aggressive investments in product
development and substantial marketing
efforts to capitalize on the new and competi -
tive product portfolio. Operating income
remained at the same level as in 2004, SEK
943 M (940).
As an effect of the recovery in the aero-
space industry, volumes rose for Volvo Aero.
Combined with a favorable product mix and
price realization, this resulted in an increase
in operating income of 107% to SEK 836 M
in 2005.
During the year Celero Support AB was
divested with a capital gain of SEK 430 M. In
total during 2005, Volvo’s holding in Peach
County Holding Inc. (Blue Bird) impacted oper-
ating income negatively with an amount of SEK
653 M including a write-down of SEK 550 M
during the fourth quarter.
Impact of exchange rates
on operating income
The average exchange rates between the
Swedish krona and other major currencies
such as the US dollar and the Euro were almost
unchanged for 2005 compared to 2004. As a
consequence, the impact on operating income
from currency movements was significantly
less in 2005 with a positive impact of about
SEK 100 M.
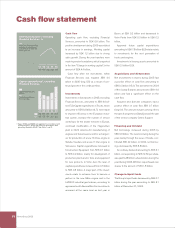
Financial net
The net interest expense for 2005 amounted
to SEK 318 M compared to SEK 433 M for the
previous year. The improvement is primarily
a result of lower cost for the pension liability
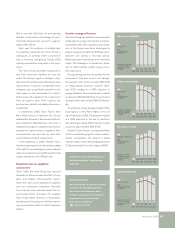
2.8 3.2 3.7 3.8 3.3
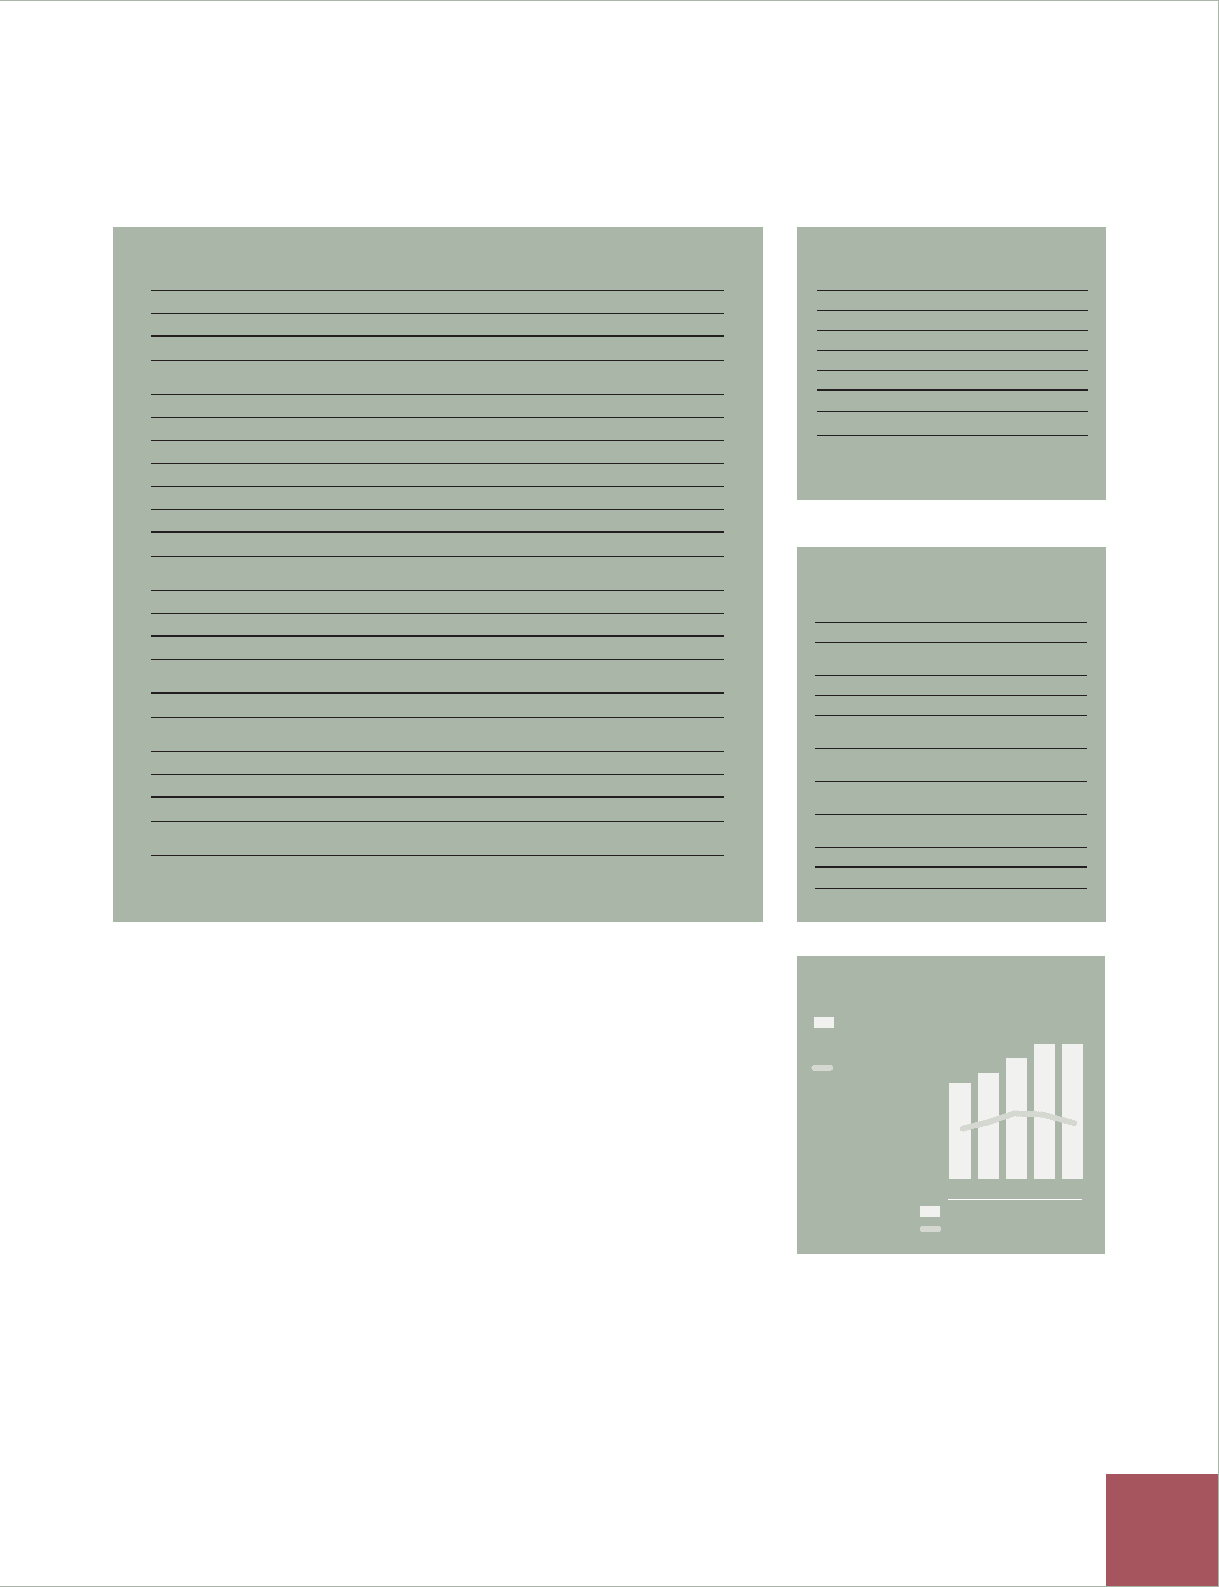
Research and development costs1
Research and development
costs, SEK bn
Research and
development costs,
% of net sales
01 02 03 04 05
5,4 5,9 6,8
3,0 3,3 3,9 7,6
3,8 7,6
3,3
1 Years 2004 and 2005 are reported in accordance with
IFRS and 2001, 2002 and 2003 in accordance with
prevailing Swedish GAAP. See Note 1 and 3.