Volvo 2005 Annual Report Download - page 16
Download and view the complete annual report
Please find page 16 of the 2005 Volvo annual report below. You can navigate through the pages in the report by either clicking on the pages listed below, or by using the keyword search tool below to find specific information within the annual report.-
 1
1 -
2
-
3
-
4
-
5
-
 6
6 -
 7
7 -
 8
8 -
 9
9 -
 10
10 -
 11
11 -
 12
12 -
 13
13 -
 14
14 -
 15
15 -
 16
16 -
 17
17 -
 18
18 -
 19
19 -
 20
20 -
 21
21 -
 22
22 -
 23
23 -
 24
24 -
 25
25 -
 26
26 -
27
-
28
-
29
-
30
-
31
-
32
-
33
-
34
-
35
-
36
-
37
-
38
-
39
-
40
-
41
-
42
-
43
-
44
-
45
-
46
-
47
-
48
-
49
-
50
-
51
-
52
-
53
-
54
-
55
-
56
-
57
-
58
-
59
-
60
-
61
-
62
-
63
-
64
-
65
-
66
-
67
-
68
-
69
-
70
-
71
-
72
-
73
-
74
-
75
-
76
-
77
-
78
-
79
-
80
-
81
-
82
-
83
-
84
-
85
-
86
-
87
-
88
-
89
-
90
-
91
-
92
-
93
-
94
-
95
-
96
-
97
-
98
-
99
-
100
-
101
-
102
-
103
-
104
-
105
-
106
-
107
-
108
-
109
-
110
-
111
-
112
-
113
-
114
-
115
-
116
-
117
-
118
-
119
-
120
-
121
-
122
-
123
-
124
-
125
-
126
-
127
-
128
-
129
-
130
-
131
-
132
-
133
-
134
-
135
-
136
-
137
-
138
-
139
-
140
-
141
-
142
-
143
-
144
-
145
-
146
-
147
-
148
-
149
-
150
-
151
-
152
-
153
-
154
-
155
-
156
-
157
-
158
-
159
-
160
-
161
-
162
 |
 |

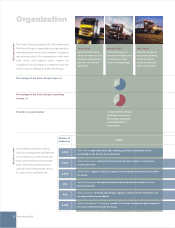
Targets and
execution
01 03
50 (2)
02
(1)
0
10
05
14
01 03
(0.4) 1.6
02
1.4
0
7
5
05
7.9
01 03
(1.7) 1.7
02
0.4
0
05
17.8
01 03
(8.2) (7.7)
02
(3.3)
15
0
–30 05
23.7
04
16
04
7.3
04
13.9
04
25.8
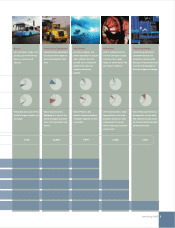
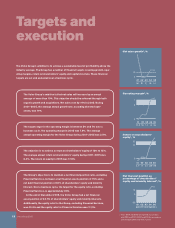
Net sales growth1, %
Operating margin1, %
Return on shareholders’
equity1, %
Net financial position as
percentage of shareholders’
equity and minority interest1, %
15
12
The Volvo Group’s ambition is to achieve a sustainable level of profitability above the
industry average. The Group has a number of financial targets covering growth, oper-
ating margins, return on shareholders’ equity and capital structure. These financial
targets are set and evaluated over a business cycle.
The Volvo Group’s ambition is that net sales will increase by an annual
average of more than 10%. This objective should be achieved through both
organic growth and acquisitions. Net sales rose by 14% in 2005. During
2001–2005, the average annual growth rate, excluding divested oper-
ations, was 14%.
The target range for the operating margin is between 5% and 7% over a
business cycle. The operating margin in 2005 was 7.9%. The average
annual operating margin for the Volvo Group during 2001–2005 was 3.9%.
The objective is to achieve a return on shareholders’ equity of 12% to 15%.
The average annual return on shareholders’ equity during 2001–2005 was
6.4%. The return on equity in 2005 was 17.8%.
The Group’s objective is to maintain a net financial position ratio, excluding
Financial Services, between a net financial assets position of 15% and a
net debt financial position of 30% of shareholders’ equity and minority
interest. Over a business cycle, the target for the equity ratio, excluding
Financial Services, is approximately 40%.
At the end of December 2005, the Volvo Group had a net financial
asset position of 23.7% of shareholders’ equity and minority interests.
Additionally, the equity ratio for the Group, excluding Financial Services,
was 40.4% and the equity ratio for Financial Services was 11,2%.
1 Years 2004 and 2005 are reported in accordanc
with IFRS and 2001, 2002 and 2003 in accordance
with Swedish GAAP. See Note 1 and 3.
12 Volvo Group 2005