Volvo 2005 Annual Report Download - page 117
Download and view the complete annual report
Please find page 117 of the 2005 Volvo annual report below. You can navigate through the pages in the report by either clicking on the pages listed below, or by using the keyword search tool below to find specific information within the annual report.-
 1
1 -
2
-
3
-
4
-
5
-
6
-
7
-
8
-
9
-
10
-
11
-
12
-
13
-
14
-
15
-
16
-
17
-
18
-
19
-
20
-
21
-
22
-
23
-
24
-
25
-
26
-
27
-
28
-
29
-
30
-
31
-
32
-
33
-
34
-
35
-
36
-
37
-
38
-
39
-
40
-
41
-
42
-
43
-
44
-
45
-
46
-
47
-
48
-
49
-
50
-
51
-
52
-
53
-
54
-
55
-
56
-
57
-
58
-
59
-
60
-
61
-
62
-
63
-
64
-
65
-
66
-
67
-
68
-
69
-
70
-
71
-
72
-
73
-
74
-
75
-
76
-
77
-
78
-
79
-
80
-
81
-
82
-
83
-
84
-
85
-
86
-
87
-
88
-
89
-
90
-
91
-
92
-
93
-
94
-
95
-
96
-
97
-
98
-
99
-
100
-
101
-
102
-
103
-
104
-
105
-
106
-
 107
107 -
 108
108 -
 109
109 -
 110
110 -
 111
111 -
 112
112 -
 113
113 -
 114
114 -
 115
115 -
 116
116 -
 117
117 -
 118
118 -
 119
119 -
 120
120 -
 121
121 -
 122
122 -
 123
123 -
 124
124 -
 125
125 -
 126
126 -
 127
127 -
128
-
129
-
130
-
131
-
132
-
133
-
134
-
135
-
136
-
137
-
138
-
139
-
140
-
141
-
142
-
143
-
144
-
145
-
146
-
147
-
148
-
149
-
150
-
151
-
152
-
153
-
154
-
155
-
156
-
157
-
158
-
159
-
160
-
161
-
162
 |
 |
Volvo Group 2005 113
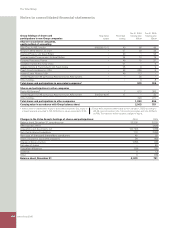
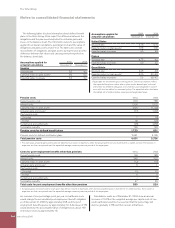
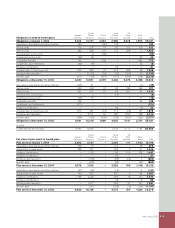
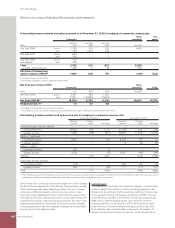
Note 25 Other provisions
Value in Provisions Acquired and Trans- Value in Whereof Whereof
balance and divested lation Reclassi- balance due within due after
sheet 2004 reversals Utilization companies differences fi cations sheet 2005 12 months 12 months
Warranties 6,742 7,332 (6,610) 4 639 56 8,163 4,441 3,722
Provisions in insurance operations 312 76 – – – – 388 – 388
Restructuring measures 571 (27) (215) 7 30 6 372 273 99
Provisions for residual value risks 987 95 (186) 7 123 (95) 931 472 459
Provisions for service contracts 1,512 379 (327) (39) 97 1 1,623 914 710
Other provisions 4,354 2,436 (2,368) 24 481 (113) 4,814 3,179 1,634
Total 14,478 10,291 (9,706) 3 1,370 (145) 16,291 9,279 7,012
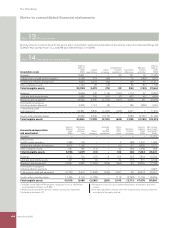
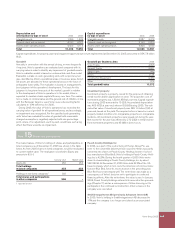
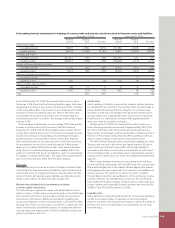
Note 26 Non-current liabilities
The listing below shows the Group’s non-current liabilities in which
the largest loans are distributed by currency. Most are issued by
Volvo Treasury AB.
Information on loan terms is as of December 31, 2005. Volvo
hedges foreign-exchange and interest-rate risks using derivative
instruments. See Note 36.
Bond loans 2004 2005
GBP 2004/2006, 5.18% 1,905 –
SEK 1998–2005/2007–2009, 1.78–5.2% 4,798 4,931
JPY 2001–2005/2007–2011, 0.42–2.3% 542 475
HKD 1999/2006, 7.99% 85 –
CZK 2001–2005/2007–2010, 2.27–6.5% 380 400
USD 1998–2005/2007–2008, 4.29–5.0% 2,150 1,788
EUR 1997–2005/2007–2011, 2.33–6.12 17,546 19,928
Other bond loans 206 48
Total 27,612 27,570
Other loans 2004 2005
USD 1989–2005/2007–2015, 4.07–13.0% 5,360 6,193
EUR 1996–2005/2007–2013, 0.5–9.59% 2,596 2,735
GBP 1995–2004/2007–2010, 4.87–7.58% 1,269 1,859
SEK 1992–2004/2007–2013, 2.19–4.85% 519 647
BRL 2000–2005/2008–2011, 5.0–18.35% 944 1,230
CAD 2002–2004/2008–2010, 3.78–3.88% 1,557 1,950
AUD 2004/2008, 5.89% 49 –
MXN 2003/2007, 9.19–9.34% – 835
Other loans 505 536
Total other long-term loans 12,799 15,985
Deferred leasing income 1,377 1,689
Residual value liability 3,122 2,931
Other long-term liabilities 154 639
Total 45,064 48,814
Of the above long-term loans, 1,501 (1,422) was secured.