Volvo 2005 Annual Report Download - page 87
Download and view the complete annual report
Please find page 87 of the 2005 Volvo annual report below. You can navigate through the pages in the report by either clicking on the pages listed below, or by using the keyword search tool below to find specific information within the annual report.-
 1
1 -
2
-
3
-
4
-
5
-
6
-
7
-
8
-
9
-
10
-
11
-
12
-
13
-
14
-
15
-
16
-
17
-
18
-
19
-
20
-
21
-
22
-
23
-
24
-
25
-
26
-
27
-
28
-
29
-
30
-
31
-
32
-
33
-
34
-
35
-
36
-
37
-
38
-
39
-
40
-
41
-
42
-
43
-
44
-
45
-
46
-
47
-
48
-
49
-
50
-
51
-
52
-
53
-
54
-
55
-
56
-
57
-
58
-
59
-
60
-
61
-
62
-
63
-
64
-
65
-
66
-
67
-
68
-
69
-
70
-
71
-
72
-
73
-
74
-
75
-
76
-
 77
77 -
 78
78 -
 79
79 -
 80
80 -
 81
81 -
 82
82 -
 83
83 -
 84
84 -
 85
85 -
 86
86 -
 87
87 -
 88
88 -
 89
89 -
 90
90 -
 91
91 -
 92
92 -
 93
93 -
 94
94 -
 95
95 -
 96
96 -
 97
97 -
98
-
99
-
100
-
101
-
102
-
103
-
104
-
105
-
106
-
107
-
108
-
109
-
110
-
111
-
112
-
113
-
114
-
115
-
116
-
117
-
118
-
119
-
120
-
121
-
122
-
123
-
124
-
125
-
126
-
127
-
128
-
129
-
130
-
131
-
132
-
133
-
134
-
135
-
136
-
137
-
138
-
139
-
140
-
141
-
142
-
143
-
144
-
145
-
146
-
147
-
148
-
149
-
150
-
151
-
152
-
153
-
154
-
155
-
156
-
157
-
158
-
159
-
160
-
161
-
162
 |
 |

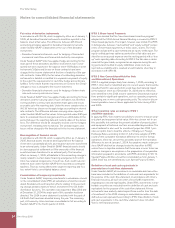
Changes in consolidated
Shareholders’ equity
Volvo Group 2005 83
Shareholders´ equity attributable to equity holders of the parent company
Other Translation Retained Minority Total
SEK M Share capital reserves reserve earnings Total interest equity
Balance at January 1, 2004 2,649 – – 69,666 72,315 217 72,532
Translation differences – – (151) – (151) (6) (157)
Translation differences on hedge instruments
of net investments in foreign operations – – 80 – 80 – 80
Net income recognised directly in equity – – (71) – (71) (6) (77)
Income for the period – – – 9,867 9,867 40 9,907
Total recognised income and
expense for the period – – (71) 9,867 9,796 34 9,830
Cash dividend – – – (3,356) (3,356) (9) (3,365)
Distribution of shares in Ainax AB to shareholders – – – (6,310) (6,310) – (6,310)
Repurchase own shares Note 23 – – – (2,532) (2,532) – (2,532)
Share based payments Note 34 – – – 14 14 – 14
Other changes – – – (1) (1) (13) (14)
Balance at December 31, 2004 2,649 – (71) 67,348 69,926 229 70,155
IFRS Transition effect IAS 39 – 1,007 – (659) 348 – 348
Balance at January 1, 2005 2,649 1,007 (71) 66,689 70,274 229 70,503
Translation differences – 24 3,543 – 3,567 24 3,591
Translation differences on hedge instruments
of net investments in foreign operations – – (220) – (220) – (220)
Available-for-sale investments: Note 15
Valuation gains/(losses) taken to equity – 83 – – 83 – 83
Cash fl ow hedges Note 36 – (1,442) – – (1,442) – (1,442)
Net income recognised directly in equity – (1,335) 3,323 – 1,988 24 2,012
Income for the period – – – 13,052 13,052 54 13,106
Total recognised income and expense for the period – (1,335) 3,323 13,052 15,040 78 15,118
Cash dividend – – – (5,055) (5,055) (28) (5,083)
Repurchase own shares Note 23 – – – (1,764) (1,764) – (1,764)
Share based payments Note 34 – – – 23 23 – 23
Decrease of share capital Note 23 (95) – – 95 – – –
Other changes – – – (10) (10) (19) (29)
Balance at December 31, 2005 2,554 (328) 3,252 73,030 78,508 260 78,768