Volvo 2005 Annual Report Download - page 57
Download and view the complete annual report
Please find page 57 of the 2005 Volvo annual report below. You can navigate through the pages in the report by either clicking on the pages listed below, or by using the keyword search tool below to find specific information within the annual report.-
 1
1 -
2
-
3
-
4
-
5
-
6
-
7
-
8
-
9
-
10
-
11
-
12
-
13
-
14
-
15
-
16
-
17
-
18
-
19
-
20
-
21
-
22
-
23
-
24
-
25
-
26
-
27
-
28
-
29
-
30
-
31
-
32
-
33
-
34
-
35
-
36
-
37
-
38
-
39
-
40
-
41
-
42
-
43
-
44
-
45
-
46
-
 47
47 -
 48
48 -
 49
49 -
 50
50 -
 51
51 -
 52
52 -
 53
53 -
 54
54 -
 55
55 -
 56
56 -
 57
57 -
 58
58 -
 59
59 -
 60
60 -
 61
61 -
 62
62 -
 63
63 -
 64
64 -
 65
65 -
 66
66 -
 67
67 -
68
-
69
-
70
-
71
-
72
-
73
-
74
-
75
-
76
-
77
-
78
-
79
-
80
-
81
-
82
-
83
-
84
-
85
-
86
-
87
-
88
-
89
-
90
-
91
-
92
-
93
-
94
-
95
-
96
-
97
-
98
-
99
-
100
-
101
-
102
-
103
-
104
-
105
-
106
-
107
-
108
-
109
-
110
-
111
-
112
-
113
-
114
-
115
-
116
-
117
-
118
-
119
-
120
-
121
-
122
-
123
-
124
-
125
-
126
-
127
-
128
-
129
-
130
-
131
-
132
-
133
-
134
-
135
-
136
-
137
-
138
-
139
-
140
-
141
-
142
-
143
-
144
-
145
-
146
-
147
-
148
-
149
-
150
-
151
-
152
-
153
-
154
-
155
-
156
-
157
-
158
-
159
-
160
-
161
-
162
 |
 |
Volvo Group 2005 53
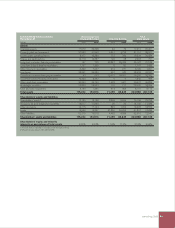
Consolidated cash-flow statements, SEK billion
SEK bn 2004 2005
Operating income 13.3 16.1
Depreciation and amortization 7.1 7.3
Other non-cash items (0.6) 0.2
Change in working capital (1.4) (5.6)
Financial items and income taxes paid (0.2) (1.9)
Cash flow from operating activities 18.2 16.1
Investing activities
Investments in fixed assets (7.2) (9.9)
Investment in leasing assets (0.3) (0.3)
Disposals of fixed assets and leasing assets 0.7 0.9
Operating cash flow excluding Financial Services 11.4 6.8
Operating cash flow, Financial Services (5.5) (4.4)
Operating cash flow, Eliminations 0.0 (0.6)
Operating cash flow, Volvo Group total 5.9 1.8
Investments and divestments of shares, net 15.1 0.3
Acquired and divested operations, net (0.1) 0.7
Interest-bearing receivables including marketable securities, net (6.4) (1.3)
Cash flow after net investments 14.5 1.5
Financing activities
Change in other loans, net (8.8) 3.6
Repurchase of own shares (2.5) (1.8)
Dividend to AB Volvo’s shareholders (3.4) (5.1)
Other 0.0 0.0
Change in cash and cash equivalents
excl translation differences (0.2) (1.8)
Translation differences on cash and cash equivalents (0.2) 1.1
Change in cash and cash equivalents (0.4) (0.7)
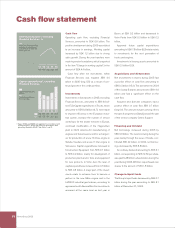
Condensed cash-flow statements,
Financial Services
SEK bn 2004 2005
Cash flow from
operating activities (2.5) (4.2)
Net investments (3.0) (0.2)
Operating cash flow (5.5) (4.4)
Future capital expenditures,
approved1
SEK bn
Trucks 5.5
Buses 0.2
Construction Equipment 0.6
Volvo Penta 0.2
Volvo Aero 0.5
Other 0.8
Total 7.8
1 In property, plant and equipment.