Volvo 2005 Annual Report Download - page 151
Download and view the complete annual report
Please find page 151 of the 2005 Volvo annual report below. You can navigate through the pages in the report by either clicking on the pages listed below, or by using the keyword search tool below to find specific information within the annual report.-
 1
1 -
2
-
3
-
4
-
5
-
6
-
7
-
8
-
9
-
10
-
11
-
12
-
13
-
14
-
15
-
16
-
17
-
18
-
19
-
20
-
21
-
22
-
23
-
24
-
25
-
26
-
27
-
28
-
29
-
30
-
31
-
32
-
33
-
34
-
35
-
36
-
37
-
38
-
39
-
40
-
41
-
42
-
43
-
44
-
45
-
46
-
47
-
48
-
49
-
50
-
51
-
52
-
53
-
54
-
55
-
56
-
57
-
58
-
59
-
60
-
61
-
62
-
63
-
64
-
65
-
66
-
67
-
68
-
69
-
70
-
71
-
72
-
73
-
74
-
75
-
76
-
77
-
78
-
79
-
80
-
81
-
82
-
83
-
84
-
85
-
86
-
87
-
88
-
89
-
90
-
91
-
92
-
93
-
94
-
95
-
96
-
97
-
98
-
99
-
100
-
101
-
102
-
103
-
104
-
105
-
106
-
107
-
108
-
109
-
110
-
111
-
112
-
113
-
114
-
115
-
116
-
117
-
118
-
119
-
120
-
121
-
122
-
123
-
124
-
125
-
126
-
127
-
128
-
129
-
130
-
131
-
132
-
133
-
134
-
135
-
136
-
137
-
138
-
139
-
140
-
 141
141 -
 142
142 -
 143
143 -
 144
144 -
 145
145 -
 146
146 -
 147
147 -
 148
148 -
 149
149 -
 150
150 -
 151
151 -
 152
152 -
 153
153 -
 154
154 -
 155
155 -
 156
156 -
 157
157 -
 158
158 -
 159
159 -
 160
160 -
 161
161 -
162
 |
 |

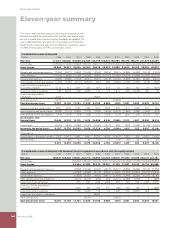
Volvo Group 2005 147
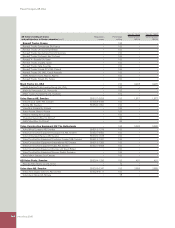
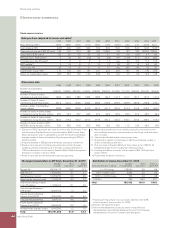
Consolidated balance sheets
SEK M 1995 1996 1997 1998 1999 2000 2001 2002 2003 2004 2005
Intangible assets 5,626 2,277 3,284 5,778 6,618 6,925 17,525 17,045 16,756 17,612 20,421
Property, plant and equipment 25,094 26,458 30,793 36,207 19,788 22,231 33,234 30,799 30,640 31,151 35,001
Assets under operating leases 2,847 4,968 13,501 22,285 12,337 14,216 27,101 23,525 21,201 19,534 20,839
Shares and participations 18,087 12,412 4,583 3,393 29,213 30,481 27,798 27,492 22,206 2,003 751
Inventories 23,929 23,148 27,993 32,128 21,438 23,551 31,075 28,305 26,459 28,598 33,937
Customer fi nancing receivables 10,336 15,552 32,304 46,798 34,313 41,791 48,784 46,998 46,002 51,193 64,466
Interest-bearing receivables 2,766 4,080 4,667 4,735 18,617 19,228 8,079 5,490 6,632 3,384 1,897
Other receivables 26,708 25,603 27,087 34,197 24,019 26,352 39,946 33,990 32,621 35,747 42,876
Liquid funds 23,306 26,661 20,603 20,224 29,269 15,968 27,383 25,578 28,735 34,746 36,947
Assets 138,699 141,159 164,815 205,745 195,612 200,743 260,925 239,222 231,252 223,968 257,135
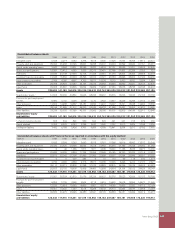
Shareholders’ equity
1 51,805 58,380 62,850 70,235 98,236 88,931 85,576 78,525 72,636 70,155 78,768
Provision for post employment
benefi ts 6,890 3,150 3,296 2,936 2,130 2,632 14,647 16,236 15,288 14,703 11,986
Other provisions 14,602 14,988 19,657 25,187 14,832 14,941 18,427 16,721 15,048 14,993 18,556
Loans 28,166 31,886 41,217 64,230 53,345 66,233 81,568 72,437 74,092 61,807 74,885
Other liabilities 37,236 32,755 37,795 43,157 27,069 28,006 60,707 55,303 54,188 62,310 72,940
Shareholders’ equity
and liabilities 138,699 141,159 164,815 205,745 195,612 200,743 260,925 239,222 231,252 223,968 257,135
1 of which minority interests 605 504 899 860 544 593 391 247 216 229 260
Assets pledged 5,434 6,503 6,743 5,388 3,930 2,990 3,737 3,610 3,809 3,046 3,255
Contingent liabilities 7,450 6,188 5,406 6,737 6,666 6,789 10,441 9,334 9,611 9,189 7,850
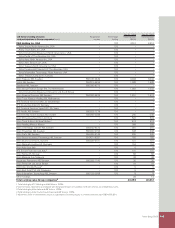
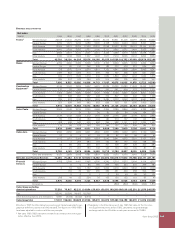
Consolidated balance sheets with Financial Services reported in accordance with the equity method
SEK M 1995 1996 1997 1998 1999 2000 2001 2002 2003 2004 2005
Intangible assets 5,623 2,258 3,262 5,692 6,518 6,781 17,366 16,919 16,662 17,570 20,348
Property, plant and equipment 23,430 24,720 28,755 33,944 17,318 19,652 30,370 27,789 27,248 27,260 31,263
Assets under operating leases 0 49 1,366 1,817 1,611 4,245 15,020 11,155 8,976 8,477 10,260
Shares and participations 20,699 16,359 9,894 11,744 35,296 37,366 35,145 34,750 30,022 10,116 10,357
Inventories 23,813 23,042 27,756 31,883 21,053 22,998 30,557 27,564 25,848 28,291 33,583
Customer fi nancing receivables 0 0 227 384 9 15 114 99 118 230 1,377
Interest bearing receivables 2,720 4,060 4,664 4,715 18,617 19,286 12,426 8,495 9,413 12,127 7,691
Other receivables 26,110 24,312 25,802 31,398 21,075 24,882 38,815 34,256 33,079 36,535 43,987
Liquid funds 20,637 23,170 16,605 15,439 24,465 10,958 24,874 24,154 28,102 34,628 36,047
Assets 123,032 117,970 118,331 137,016 145,962 146,183 204,687 185,181 179,468 175,234 194,913
Shareholders’ equity 51,551 58,324 62,810 70,179 98,236 88,931 85,576 78,525 72,636 70,155 78,768
Provision for post-employment
benefi ts 6,855 3,126 3,266 2,904 2,118 2,619 14,632 16,218 15,264 14,677 11,966
Other provisions 12,525 12,618 15,962 19,435 9,861 8,277 14,085 13,893 12,792 14,115 17,164
Loans 16,301 13,432 1,047 5,018 12,206 18,233 29,710 22,494 24,677 13,968 13,097
Other liabilities 35,800 30,470 35,246 39,480 23,541 28,123 60,684 54,051 54,099 62,319 73,918
Shareholders’ equity
and liabilities 123,032 117,970 118,331 137,016 145,962 146,183 204,687 185,181 179,468 175,234 194,913