Volvo 2005 Annual Report Download - page 32
Download and view the complete annual report
Please find page 32 of the 2005 Volvo annual report below. You can navigate through the pages in the report by either clicking on the pages listed below, or by using the keyword search tool below to find specific information within the annual report.-
 1
1 -
2
-
3
-
4
-
5
-
6
-
7
-
8
-
9
-
10
-
11
-
12
-
13
-
14
-
15
-
16
-
17
-
18
-
19
-
20
-
21
-
 22
22 -
 23
23 -
 24
24 -
 25
25 -
 26
26 -
 27
27 -
 28
28 -
 29
29 -
 30
30 -
 31
31 -
 32
32 -
 33
33 -
 34
34 -
 35
35 -
 36
36 -
 37
37 -
 38
38 -
 39
39 -
 40
40 -
 41
41 -
 42
42 -
43
-
44
-
45
-
46
-
47
-
48
-
49
-
50
-
51
-
52
-
53
-
54
-
55
-
56
-
57
-
58
-
59
-
60
-
61
-
62
-
63
-
64
-
65
-
66
-
67
-
68
-
69
-
70
-
71
-
72
-
73
-
74
-
75
-
76
-
77
-
78
-
79
-
80
-
81
-
82
-
83
-
84
-
85
-
86
-
87
-
88
-
89
-
90
-
91
-
92
-
93
-
94
-
95
-
96
-
97
-
98
-
99
-
100
-
101
-
102
-
103
-
104
-
105
-
106
-
107
-
108
-
109
-
110
-
111
-
112
-
113
-
114
-
115
-
116
-
117
-
118
-
119
-
120
-
121
-
122
-
123
-
124
-
125
-
126
-
127
-
128
-
129
-
130
-
131
-
132
-
133
-
134
-
135
-
136
-
137
-
138
-
139
-
140
-
141
-
142
-
143
-
144
-
145
-
146
-
147
-
148
-
149
-
150
-
151
-
152
-
153
-
154
-
155
-
156
-
157
-
158
-
159
-
160
-
161
-
162
 |
 |

28 Volvo Group 2005
The share
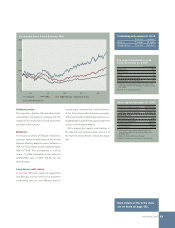
Favorable share performance
The trend on the world’s leading stock
exchanges during 2005 was generally favor-
able. On the Stockholm Stock Exchange, the
Affärsvärlden General Index (AFSX) rose
by 33%.
On the Stockholm Stock Exchange, the
Volvo B share gained 42% during 2005, com-
pared with an increase of 48% for the MSCI
Europe Machinery Index, Morgan Stanley’s
European index of engineering companies.
At the end of the year, the share price for
the B share was SEK 374.50, compared with
SEK 263.50 at the end of 2004. The highest
price paid during the year was SEK 378.50, on
December 30, 2005, a record high. The lowest
price paid was SEK 260.00 on January 5,
2005.
Market capitalization
At December 31, 2005, the market capitaliza-
tion of Volvo amounted to SEK 150 billion,
compared with SEK 107 billion at December
31, 2004. Volvo’s market capitalization was
equivalent to 4.5% of the total market cap-
italization of the Stockholm Stock Exchange.
Trading
The majority of trading in Volvo shares takes
place via the Stockholm Stock Exchange,
where the shares have been listed since 1935.
Trading in Volvo involves Volvo A and Volvo B
shares with the tickers VOLV A and VOLV B
respectively. A trading block comprises 100
shares.
During 2005, a total of 558 (540) million
shares were traded on the Stockholm Stock
Exchange, corresponding to a daily average
of 2.2 (2.1) million shares traded. The turnover
rate was 129%, compared with 124% for the
Stockholm Stock Exchange as a whole.
ADR program in the United States
Since 1985, a program for American Deposit-
ary Receipts (ADRs) has existed in the United
States. Each ADR represents one Volvo B
sha r e a nd t he Vol vo AD R i s tr a de d w i th the
ticker VOLVY on NASDAQ. In 2005, the
average daily volumes of ADRs traded were
78,555 (94,695) and the total number of
outstanding ADRs at year-end was about
13 million (20 million).
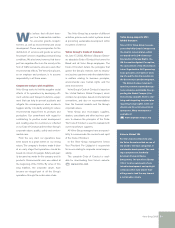
Sweden (51)
France (22)
US (11)
UK (7)
Switzerland (2)
Others (7)
1 Share of capital, registered shares.
Ownership by country1, %
1 Share of capital, registered shares.
Non-Swedish owners (49)
Savings funds (11)
Pension funds
and insurance
companies (17)
Swedish private
shareholders (12)
Others (11)
Ownership categories1, %
8.0 8.0 8.0 12.5 16.75
(3.5) 3.3 0.7 23.6 32.2
Earnings1 and cash
dividend per share
1 Years 2004 and 2005 are reported
in accordance with IFRS and 2001,
2002 and 2003 in accordance with
prevailing Swedish GAAP.
See Note 1 and 3.
01 02 03 04 05
Earnings1
per share, SEK
Dividend per share, SEK
0
4.5 5.6 10.5
17.6 (14.8) 71.2
4.7
25.5
4.5
48.5
Direct return
Effective return
Direct return1 and
effective return2, %
1 Dividend as percentage
of share price.
2 Share price at year-end, including
proposed dividend during the
year, divided by share price at
the beginning of the year.
01 02 03 04 05
0
Volvo included in Dow Jones
Sustainability Index
Since 2002, Volvo has been
included in the Dow Jones
Sustainability World Index (DJSI
World). DJSI World is a worldwide
index based on global companies’
efforts regarding sustainable devel-
opment. Companies are evaluated
annually according to a model
embracing finance, environment and
social factors. DJSI World comprises
the highest-ranked
10% of the 2,500
companies included
in the Dow Jones
Global Index. Volvo
is also one of
slightly more than
170 companies
included in the Dow Jones STOXX
Sustainability Index, which com-
prises leading European companies.
Further information is available at
www.sustainability-indexes.com
➡