Volvo 2005 Annual Report Download - page 105
Download and view the complete annual report
Please find page 105 of the 2005 Volvo annual report below. You can navigate through the pages in the report by either clicking on the pages listed below, or by using the keyword search tool below to find specific information within the annual report.-
 1
1 -
2
-
3
-
4
-
5
-
6
-
7
-
8
-
9
-
10
-
11
-
12
-
13
-
14
-
15
-
16
-
17
-
18
-
19
-
20
-
21
-
22
-
23
-
24
-
25
-
26
-
27
-
28
-
29
-
30
-
31
-
32
-
33
-
34
-
35
-
36
-
37
-
38
-
39
-
40
-
41
-
42
-
43
-
44
-
45
-
46
-
47
-
48
-
49
-
50
-
51
-
52
-
53
-
54
-
55
-
56
-
57
-
58
-
59
-
60
-
61
-
62
-
63
-
64
-
65
-
66
-
67
-
68
-
69
-
70
-
71
-
72
-
73
-
74
-
75
-
76
-
77
-
78
-
79
-
80
-
81
-
82
-
83
-
84
-
85
-
86
-
87
-
88
-
89
-
90
-
91
-
92
-
93
-
94
-
 95
95 -
 96
96 -
 97
97 -
 98
98 -
 99
99 -
 100
100 -
 101
101 -
 102
102 -
 103
103 -
 104
104 -
 105
105 -
 106
106 -
 107
107 -
 108
108 -
 109
109 -
 110
110 -
 111
111 -
 112
112 -
 113
113 -
 114
114 -
 115
115 -
116
-
117
-
118
-
119
-
120
-
121
-
122
-
123
-
124
-
125
-
126
-
127
-
128
-
129
-
130
-
131
-
132
-
133
-
134
-
135
-
136
-
137
-
138
-
139
-
140
-
141
-
142
-
143
-
144
-
145
-
146
-
147
-
148
-
149
-
150
-
151
-
152
-
153
-
154
-
155
-
156
-
157
-
158
-
159
-
160
-
161
-
162
 |
 |
Volvo Group 2005 101
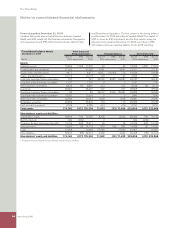
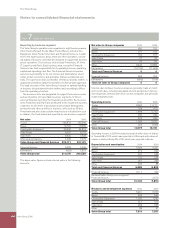
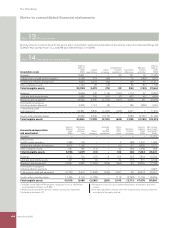
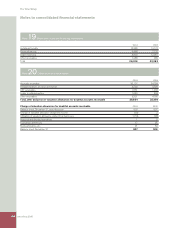
Income from investments in
associated companies 2004 2005
Trucks 13 (6)
Buses 1 7
Construction Equipment – 0
Volvo Penta – 0
Volvo Aero (1) 68
Other (11) (637)
Volvo Group excl Financial Services 2 (568)
Financial Services 25 11
Volvo Group total 27 (557)
Total assets 2004 2005
Operating assets, excluding
Financial Services:
1
Trucks 71,439 83,908
Buses 8,017 10,499
Construction Equipment 16,858 21,435
Volvo Penta 3,242 3,700
Volvo Aero 8,695 10,118
Other
3,881 2,938
Total operating assets excluding
Financial Services 112,132 132,598
Interest-bearing fi nancial assets 46,312 43,939
Tax receivables 6,259 5,982
Total assets in Financial Services 71,499 85,849
Other and eliminations (12,234) (11,233)
Volvo Group total 223,968 257,135
1 Defi ned as Total assets less Interest-bearing fi nancial assets and Tax
receivables.
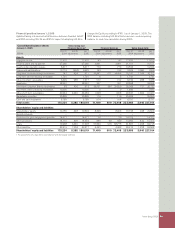
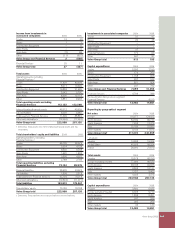
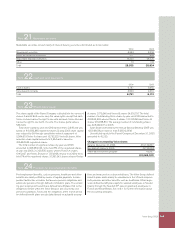
Total shareholders’ equity and liabilities 2004 2005
Operating liabilities, excluding
Financial Services:1
Trucks 55,105 62,675
Buses 3,324 4,728
Construction Equipment 6,602 9,348
Volvo Penta 1,620 1,820
Volvo Aero 3,695 4,622
Other 2,788 2,783
Total operating liabilities excluding
Financial Services 73,134 85,976
Financial liabilities 28,402 24,670
Tax liabilities 1,608 2,578
Total liabilities in Financial Services 63,193 76,214
Other and eliminations (12,524) (11,071)
Total liabilities 153,813 178,367
Shareholders’ equity 70,155 78,768
Volvo Group total 223,968 257,135
1 Defi ned as Total liabilities less fi nancial liabilities and tax liabilities.
Investments in associated companies 2004 2005
Trucks 37 47
Buses 20 35
Construction Equipment – –
Volvo Penta – –
Volvo Aero 37 3
Financial Services 172 23
Other 647 87
Volvo Group total 913 195
Capital expenditures 2004 2005
Trucks 5,030 7,190
Buses 176 250
Construction Equipment 1,158 906
Volvo Penta 297 243
Volvo Aero 801 904
Other 237 762
Volvo Group excl Financial Services 7,699 10,255
Financial Services 4,784 386
Reclassifi cation Group versus segment
Financial Services – 4,210
Volvo Group total 12,483 14,851
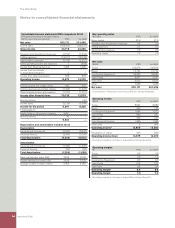
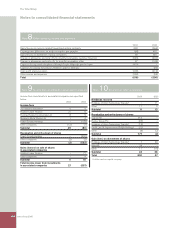
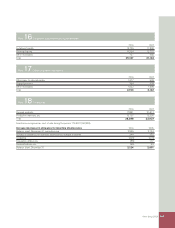
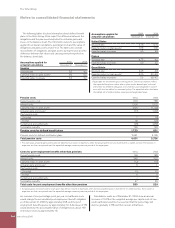
Reporting by geographical segment
Net sales 2004 2005
Europe 119,077 124,023
North America 54,769 69,743
South America 7,338 12,479
Asia 20,789 22,699
Other markets 9,103 11,615
Volvo Group total* 211,076 240,559
* of which:
Sweden 14,606 15,334
United States 45,926 59,254
France 26,900 27,610
Total assets 2004 2005
Sweden 79,578 86,793
Europe excluding Sweden 77,909 86,530
North America 48,165 60,846
South America 6,526 10,131
Asia 7,757 9,460
Other markets 4,033 3,375
Volvo Group total 223,968 257,135
Capital expenditures 2004 2005
Sweden 3,690 5,935
Europe excluding Sweden 6,305 5,770
North America 1,835 2,451
South America 247 296
Asia 362 259
Other markets 44 140
Volvo Group total 12,483 14,851