Volvo 2005 Annual Report Download - page 114
Download and view the complete annual report
Please find page 114 of the 2005 Volvo annual report below. You can navigate through the pages in the report by either clicking on the pages listed below, or by using the keyword search tool below to find specific information within the annual report.-
 1
1 -
2
-
3
-
4
-
5
-
6
-
7
-
8
-
9
-
10
-
11
-
12
-
13
-
14
-
15
-
16
-
17
-
18
-
19
-
20
-
21
-
22
-
23
-
24
-
25
-
26
-
27
-
28
-
29
-
30
-
31
-
32
-
33
-
34
-
35
-
36
-
37
-
38
-
39
-
40
-
41
-
42
-
43
-
44
-
45
-
46
-
47
-
48
-
49
-
50
-
51
-
52
-
53
-
54
-
55
-
56
-
57
-
58
-
59
-
60
-
61
-
62
-
63
-
64
-
65
-
66
-
67
-
68
-
69
-
70
-
71
-
72
-
73
-
74
-
75
-
76
-
77
-
78
-
79
-
80
-
81
-
82
-
83
-
84
-
85
-
86
-
87
-
88
-
89
-
90
-
91
-
92
-
93
-
94
-
95
-
96
-
97
-
98
-
99
-
100
-
101
-
102
-
103
-
 104
104 -
 105
105 -
 106
106 -
 107
107 -
 108
108 -
 109
109 -
 110
110 -
 111
111 -
 112
112 -
 113
113 -
 114
114 -
 115
115 -
 116
116 -
 117
117 -
 118
118 -
 119
119 -
 120
120 -
 121
121 -
 122
122 -
 123
123 -
 124
124 -
125
-
126
-
127
-
128
-
129
-
130
-
131
-
132
-
133
-
134
-
135
-
136
-
137
-
138
-
139
-
140
-
141
-
142
-
143
-
144
-
145
-
146
-
147
-
148
-
149
-
150
-
151
-
152
-
153
-
154
-
155
-
156
-
157
-
158
-
159
-
160
-
161
-
162
 |
 |

The Volvo Group
110 Volvo Group 2005
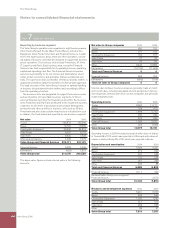
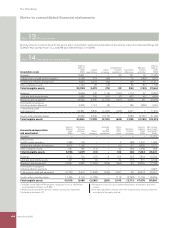
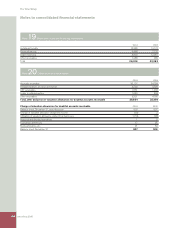
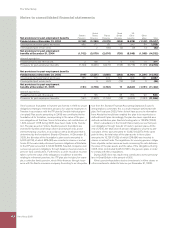
Pension costs 2004 2005
Current service costs 616 788
Interest costs 1,306 1,315
Expected return on plan assets (931) (1,133)
Actuarial gains and losses
1 (17) (107)
Past service costs
– Unvested 7 (4)
– Vested 38 (20)
Curtailments and settlements (28) (362)
Termination benefi ts 729 124
Pension costs for defi ned benefi t plans 1,720 601
Pension costs for defi ned contribution plans 2,681 3,165
Total pension costs 4,401 3,736
1 For each plan, actuarial gains and losses are reported as income or expenses, when the accumulated amount exceeds the so called corridor. The income or
expenses are then recognized over the expected average remaining service period of the employees.
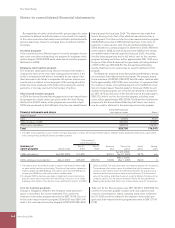
Costs for post-employment benefi ts other than pensions 2004 2005
Current service costs 196 188
Interest costs 349 323
Expected return on plan assets (12) (15)
Actuarial gains and losses
1 6 1
Past service costs
– Unvested (1) (1)
– Vested 5 4
Curtailments and settlements – 0
Termination benefi ts 47 24
Total costs for post-employment benefi ts other than pensions 590 524
1 Actuarial gains and losses are for each plan reported as income or expenses, when the accumulated amount exceed the so called corridor. The income or
expenses are then recognized over the expected average remaining service period of the employees.
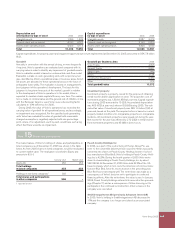
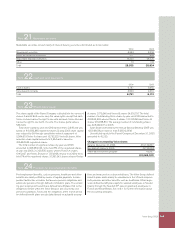
An increase of one percentage point per year in healthcare costs
would change the accumulated post-employment benefi t obligation
as of December 31, 2005 by approximately 208, and the post-
employment benefi t expense by approximately 19. A decrease of 1%
would decrease the accumulated value of obligations by about 198
and reduce costs by approximately 16.
Calculations made as of December 31, 2005 show an annual
increase of 10.0% in the weighted average per capita costs of cov-
ered healthcare benefi ts; it is assumed that the percentage will
decline gradually to 5% and then remain at that level.
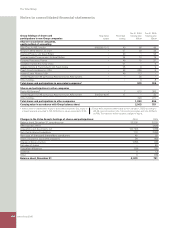
Notes to consolidated fi nancial statements
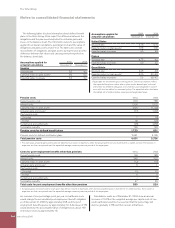
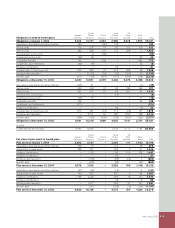
The following tables disclose information about defi ned benefi t
plans in the Volvo Group. Volvo report the difference between the
obligations and the plan assets adjusted for actuarial gains and
losses in the balance sheet. The information refers to assumptions
applied for actuarial calculations, periodical costs and the value of
obligations and plan assets at year-end. The tables also include
reconciliation of obligations and plan assets during the year and the
difference between fair values and carrying amounts reported on
the balance sheet date.
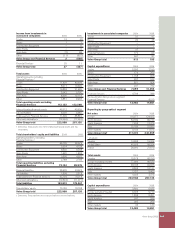
Assumptions applied for 2004 2005
actuarial calculations December 31 December 31
Sweden
Discount rate 5.0 4.0
Expected return on plan assets
1 6.0 6.0
Expected salary increases 3.2 3.2
Assumptions applied for 2004 2005
actuarial calculations December 31 December 31
United States
Discount rate 5.75 5.75
Expected return on plan assets
1 7.65 7.65
Expected salary increases 3.5 3.5
France
Discount rate 4.75 4.0
Expected salary increases 3.0 3.0
Great Britain
Discount rate 5.25 4.8
Expected return on plan assets
1 6.25 5.2–6.5
Expected salary increases 3.5 3.8–4.0
1 Applicable for the following accounting period. These assumptions refl ect
the expected long-term return rate on plan assets, based upon historical
yield rates for different categories of investments and weighted in accord-
ance with the foundation’s investment policy. The expected return has been
calculated net of administrative expenses and applicable taxes.