Volvo 2005 Annual Report Download - page 152
Download and view the complete annual report
Please find page 152 of the 2005 Volvo annual report below. You can navigate through the pages in the report by either clicking on the pages listed below, or by using the keyword search tool below to find specific information within the annual report.-
 1
1 -
2
-
3
-
4
-
5
-
6
-
7
-
8
-
9
-
10
-
11
-
12
-
13
-
14
-
15
-
16
-
17
-
18
-
19
-
20
-
21
-
22
-
23
-
24
-
25
-
26
-
27
-
28
-
29
-
30
-
31
-
32
-
33
-
34
-
35
-
36
-
37
-
38
-
39
-
40
-
41
-
42
-
43
-
44
-
45
-
46
-
47
-
48
-
49
-
50
-
51
-
52
-
53
-
54
-
55
-
56
-
57
-
58
-
59
-
60
-
61
-
62
-
63
-
64
-
65
-
66
-
67
-
68
-
69
-
70
-
71
-
72
-
73
-
74
-
75
-
76
-
77
-
78
-
79
-
80
-
81
-
82
-
83
-
84
-
85
-
86
-
87
-
88
-
89
-
90
-
91
-
92
-
93
-
94
-
95
-
96
-
97
-
98
-
99
-
100
-
101
-
102
-
103
-
104
-
105
-
106
-
107
-
108
-
109
-
110
-
111
-
112
-
113
-
114
-
115
-
116
-
117
-
118
-
119
-
120
-
121
-
122
-
123
-
124
-
125
-
126
-
127
-
128
-
129
-
130
-
131
-
132
-
133
-
134
-
135
-
136
-
137
-
138
-
139
-
140
-
141
-
 142
142 -
 143
143 -
 144
144 -
 145
145 -
 146
146 -
 147
147 -
 148
148 -
 149
149 -
 150
150 -
 151
151 -
 152
152 -
 153
153 -
 154
154 -
 155
155 -
 156
156 -
 157
157 -
 158
158 -
 159
159 -
 160
160 -
 161
161 -
 162
162
 |
 |
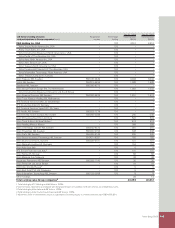
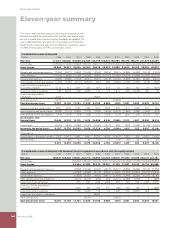
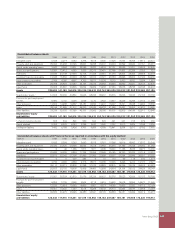
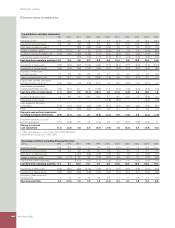
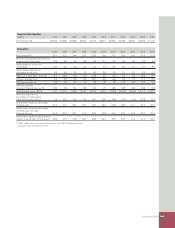
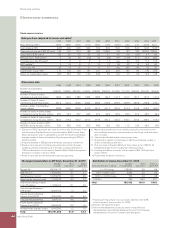
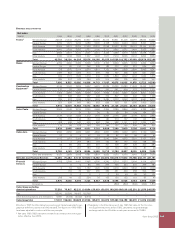
Eleven-year summary
148 Volvo Group 2005
Consolidated cash-fl ow statements
SEK bn 1995 1996 1997 1998 1999 2000 2001 2002 2003 2004 2005
Operating income
1 13.3 13.2 12.8 11.8 7.5 6.7 (0.7) 2.8 2.5 14.7 18.2
Depreciation and amortization 5.6 5.4 6.8 9.6 5.2 6.3 10.0 10.8 10.2 10.0 9.9
Other items not affecting cash
2 (3.5) (4.9) (0.3) (0.4) 0.5 2.0 4.9 (0.1) 0.4
Change in working capital
2 (7.3) (11.2) 4.7 1.5 (1.0) (3.3) 6.4 1.0 0.4 (1.4) (4.7)
Customer fi nancing receivables, net (1.6) (4.8) (15.5) (12.8) (7.1) (4.5) (3.7) (5.7) (4.3) (7.4) (7.8)
Financial items and income tax
2 (0.4) (2.0) (1.7) (1.3) (2.1) (1.3) (0.9) (0.5) (2.0)
Cash fl ow from operating activities 10.0 2.6 4.9 3.2 2.6 3.5 10.4 9.6 12.8 15.3 14.0
Investments in fi xed assets (6.5) (8.2) (9.9) (10.5) (4.9) (5.4) (8.1) (6.7) (6.0) (7.4) (10.3)
Investments in leasing assets (2.6) (3.9) (9.8) (12.7) (5.6) (5.7) (5.8) (5.2) (5.3) (4.4) (4.5)
Disposals of fi xed assets
and leasing assets 1.3 2.0 1.8 2.6 1.6 2.1 2.6 3.2 2.9 2.4 2.6
Shares and participations, net 2.0 14.1 10.7 5.5 (25.9) (1.6) 3.9 (0.1) (0.1) 15.1 0.3
Acquired and divested subsidiaries
and other business units, net (4.4) (0.9) (1.3) (5.6) 31.0 0.0 13.0 (0.2) 0.0 (0.1) 0.7
Interest-bearing receivables
including marketable securities (0.9) (7.7) 10.1 3.5 (16.9) 11.7 (3.7) (1.5) (2.0) (6.4) (1.3)
Cash fl ow after net investments (1.1) (2.0) 6.5 (14.0) (18.1) 4.6 12.3 (0.9) 2.3 14.5 1.5
Increase (decrease) in loans 1.5 6.8 5.6 19.5 16.3 8.1 6.2 (0.1) 1.9 (8.8) 3.6
Repurchase of own shares – – – – – (11.8) (8.3) – – (2.5) (1.8)
Cash dividend to AB Volvo’s
shareholders (1.5) (1.9) (2.0) (2.2) (2.6) (3.1) (3.4) (3.4) (3.4) (3.4) (5.1)
Other 0.7 (5.0) (5.9) (0.2) (0.1) 0.0 0.1 0.1 0.1 0.0 0.0
Change in cash and cash equivalents
excluding translation differences (0.4) (2.1) 4.2 3.1 (4.5) (2.2) 6.9 (4.3) 0.9 (0.2) (1.8)
Translation differences on cash
and cash equivalents (0.7) (0.3) 0.3 0.3 (0.2) 0.3 0.6 (0.7) (0.6) (0.2) 1.1
Change in cash and
cash equivalents (1.1) (2.4) 4.5 3.4 (4.7) (1.9) 7.5 (5.0) 0.3 (0.4) (0.7)
1 1999, excluding gain on sale of Volvo Cars of SEK 26.7 billion.
2 Reported on a single line in 1995–1996.
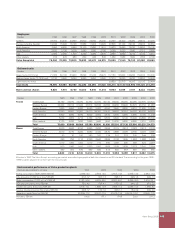
Operating cash fl ow excluding Financial Services
SEK bn 1995 1996 1997 1998 1999 2000 2001 2002 2003 2004 2005
Operating income 12.9 12.8 12.4 11.1 6.4 5.2 (1.0) 2.3 1.6 13.3 16.1
Depreciation and amortization 4.8 4.4 5.0 6.4 3.1 3.8 7.0 7.8 7.2 7.1 7.3
Other items not affecting cash (4.0) (5.5) (0.5) (1.6) 0.0 1.0 4.1 (0.6) 0.2
Change in working capital (6.3) (11.1) 3.7 0.4 (1.6) (3.0) 6.8 0.4 0.7 (1.4) (5.6)
Financial items and income taxes (0.5) (2.3) (1.7) (0.8) (2.3) (1.1) (0.7) (0.2) (1.9)
Cash fl ow from operating activities 11.4 6.1 16.6 10.1 5.7 3.6 10.5 10.4 12.9 18.2 16.1
Investments in fi xed assets (6.4) (8.0) (9.5) (10.2) (4.7) (5.1) (7.7) (6.3) (5.8) (7.2) (9.9)
Investments in leasing assets (0.8) (0.8) (0.5) (0.9) (0.5) (0.6) (0.5) (0.1) (0.1) (0.3) (0.3)
Disposals of fi xed assets and
leasing assets 1.2 1.8 1.0 1.5 0.8 0.7 1.1 1.1 0.6 0.7 0.9
Operating cash fl ow 5.4 (0.9) 7.6 0.5 1.3 (1.4) 3.4 5.1 7.6 11.4 6.8
Eleven-year summary