Volvo 2005 Annual Report Download - page 100
Download and view the complete annual report
Please find page 100 of the 2005 Volvo annual report below. You can navigate through the pages in the report by either clicking on the pages listed below, or by using the keyword search tool below to find specific information within the annual report.-
 1
1 -
2
-
3
-
4
-
5
-
6
-
7
-
8
-
9
-
10
-
11
-
12
-
13
-
14
-
15
-
16
-
17
-
18
-
19
-
20
-
21
-
22
-
23
-
24
-
25
-
26
-
27
-
28
-
29
-
30
-
31
-
32
-
33
-
34
-
35
-
36
-
37
-
38
-
39
-
40
-
41
-
42
-
43
-
44
-
45
-
46
-
47
-
48
-
49
-
50
-
51
-
52
-
53
-
54
-
55
-
56
-
57
-
58
-
59
-
60
-
61
-
62
-
63
-
64
-
65
-
66
-
67
-
68
-
69
-
70
-
71
-
72
-
73
-
74
-
75
-
76
-
77
-
78
-
79
-
80
-
81
-
82
-
83
-
84
-
85
-
86
-
87
-
88
-
89
-
 90
90 -
 91
91 -
 92
92 -
 93
93 -
 94
94 -
 95
95 -
 96
96 -
 97
97 -
 98
98 -
 99
99 -
 100
100 -
 101
101 -
 102
102 -
 103
103 -
 104
104 -
 105
105 -
 106
106 -
 107
107 -
 108
108 -
 109
109 -
 110
110 -
111
-
112
-
113
-
114
-
115
-
116
-
117
-
118
-
119
-
120
-
121
-
122
-
123
-
124
-
125
-
126
-
127
-
128
-
129
-
130
-
131
-
132
-
133
-
134
-
135
-
136
-
137
-
138
-
139
-
140
-
141
-
142
-
143
-
144
-
145
-
146
-
147
-
148
-
149
-
150
-
151
-
152
-
153
-
154
-
155
-
156
-
157
-
158
-
159
-
160
-
161
-
162
 |
 |
The Volvo Group
96 Volvo Group 2005
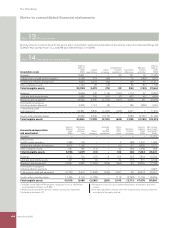
Notes to consolidated fi nancial statements
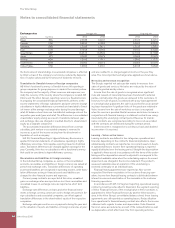
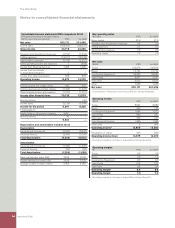
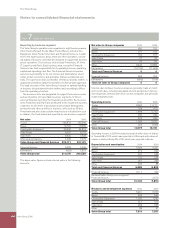
Key operating ratios
% of sales IFRS Sw GAAP
Gross margin 21.6 21.5
Research and development expenses 3.8 3.6
Selling expenses 9.1 9.0
Administrative expenses 2.6 2.6
Operating margin 7.3 7.0
Net sales
SEK M IFRS Sw GAAP
Trucks 136,879 136,879
Buses 12,722 12,722
Construction Equipment1 29,360 28,685
Volvo Penta 9,057 9,057
Volvo Aero 6,925 6,925
Other 7,228 7,228
Net sales 202,171 201,496
1 Consolidation of temporary investments, LB Smith, January–November.
Operating income
SEK M IFRS Sw GAAP
Trucks 8,992 8,989
Buses 253 185
Construction Equipment 1,898 1,572
Volvo Penta 940 937
Volvo Aero 403 377
Volvo Financial Services 1,365 1,365
Other units 8 (45)
Operating income1 13,859 13,380
Revaluation of shares 820 820
Operating income (loss) 14,679 14,200
1 Excluding revaluation of shares in Scania AB and Henlys Group Plc.
Operating margins
% IFRS Sw GAAP
Trucks 6.6 6.6
Buses 2.0 1.5
Construction Equipment 6.5 5.5
Volvo Penta 10.4 10.3
Volvo Aero 5.8 5.4
Operating margin1 6.9 6.6
Operating margin 7.3 7.0
1 Excluding revaluation of shares in Scania AB and Henlys Group Plc.
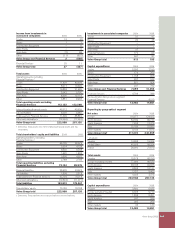
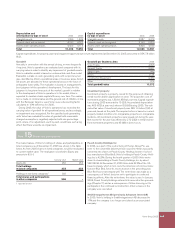
Consolidated income statements IFRS comparison 2004
VFS reported according to the equity method
SEK M unless otherwise specifi ed IFRS Sw GAAP
Net sales 202,171 201,496
Cost of sales (158,453) (158,231)
Gross income 43,718 43,265
Research and development expenses (7,614) (7,233)
Selling expenses (18,317) (18,048)
Administrative expenses (5,310) (5,321)
Other operating income and expenses 7 (658)
Income from Financial Services 1,365 1,365
Income from investments
in associated companies 2 2
Income from other investments 828 828
Operating income 14,679 14,200
Interest income and similar credits 993 993
Interest expenses and similar charges (1,426) (1,404)
Other fi nancial income and expenses (1,210) (1,210)
Income after fi nancial items 13,036 12,579
Minority interest – (40)
Income taxes (3,129) (3,184)
Income for the period 9,907 9,355
* Attributable to:
Equity holders of the parent company 9,867 –
Minority interest 40 –
9,907 –
Depreciation and amortization included above
Depreciation
Industrial and Commercial (5,540) (5,540)
Financial Services (3,066) (3,066)
Total Depreciation (8,606) (8,606)
Amortization
Industrial and Commercial (1,333) (1,635)
Financial Services (63) (63)
Total Amortization (1,396) (1,698)
Basic earnings per share, SEK 23.58 22.35
Diluted earnings per share, SEK 23.55 22.33
Average number of shares, million 418.5 418.5