Volvo 2005 Annual Report Download - page 123
Download and view the complete annual report
Please find page 123 of the 2005 Volvo annual report below. You can navigate through the pages in the report by either clicking on the pages listed below, or by using the keyword search tool below to find specific information within the annual report.-
 1
1 -
2
-
3
-
4
-
5
-
6
-
7
-
8
-
9
-
10
-
11
-
12
-
13
-
14
-
15
-
16
-
17
-
18
-
19
-
20
-
21
-
22
-
23
-
24
-
25
-
26
-
27
-
28
-
29
-
30
-
31
-
32
-
33
-
34
-
35
-
36
-
37
-
38
-
39
-
40
-
41
-
42
-
43
-
44
-
45
-
46
-
47
-
48
-
49
-
50
-
51
-
52
-
53
-
54
-
55
-
56
-
57
-
58
-
59
-
60
-
61
-
62
-
63
-
64
-
65
-
66
-
67
-
68
-
69
-
70
-
71
-
72
-
73
-
74
-
75
-
76
-
77
-
78
-
79
-
80
-
81
-
82
-
83
-
84
-
85
-
86
-
87
-
88
-
89
-
90
-
91
-
92
-
93
-
94
-
95
-
96
-
97
-
98
-
99
-
100
-
101
-
102
-
103
-
104
-
105
-
106
-
107
-
108
-
109
-
110
-
111
-
112
-
 113
113 -
 114
114 -
 115
115 -
 116
116 -
 117
117 -
 118
118 -
 119
119 -
 120
120 -
 121
121 -
 122
122 -
 123
123 -
 124
124 -
 125
125 -
 126
126 -
 127
127 -
 128
128 -
 129
129 -
 130
130 -
 131
131 -
 132
132 -
 133
133 -
134
-
135
-
136
-
137
-
138
-
139
-
140
-
141
-
142
-
143
-
144
-
145
-
146
-
147
-
148
-
149
-
150
-
151
-
152
-
153
-
154
-
155
-
156
-
157
-
158
-
159
-
160
-
161
-
162
 |
 |

Volvo Group 2005 119
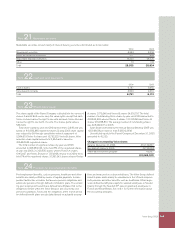
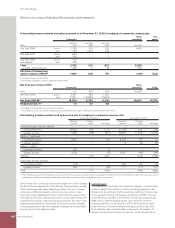
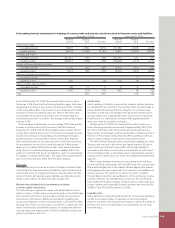
Change in number of options per program Program
Number of options 2000 2002
Dec 31, 2003 96,245 1,050,000
Alloted – –
Cancelled – (105,000)
Exercised (96,245) –
Dec 31, 2004 – 945,000
Alloted –
Cancelled (6,250)
Exercised –
Dec 31, 2005 938,750
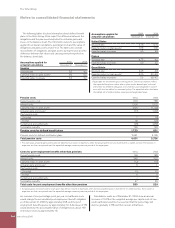
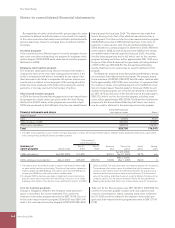
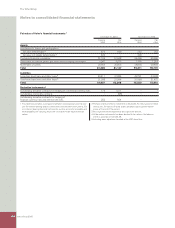
2004 2005
Number of of which Number of of which
Average number of employees employees women, % employees women, %
AB Volvo
Sweden 136 54 144 50
Subsidiaries
Sweden 27,034 18 27,843 19
Western Europe 26,325 14 25,894 14
Eastern Europe 2,731 16 3,481 15
North America 13,057 19 13,778 20
South America 3,040 12 3,656 14
Asia 4,114 16 4,273 15
Other countries 1,759 11 2,259 12
Group total 78,196 16 81,184 17
2004 2005
Number at of which Number at of which
Board members and chief offi cers year-end women, % year-end women, %
AB Volvo
Board members 11 9 11 9
CEO and GEC 17 6 17 6
Volvo Group
Board members 1,017 15 1,010 10
Presidents and other senior executives 1,276 16 1,305 16