Volvo 2005 Annual Report Download - page 54
Download and view the complete annual report
Please find page 54 of the 2005 Volvo annual report below. You can navigate through the pages in the report by either clicking on the pages listed below, or by using the keyword search tool below to find specific information within the annual report.-
 1
1 -
2
-
3
-
4
-
5
-
6
-
7
-
8
-
9
-
10
-
11
-
12
-
13
-
14
-
15
-
16
-
17
-
18
-
19
-
20
-
21
-
22
-
23
-
24
-
25
-
26
-
27
-
28
-
29
-
30
-
31
-
32
-
33
-
34
-
35
-
36
-
37
-
38
-
39
-
40
-
41
-
42
-
43
-
 44
44 -
 45
45 -
 46
46 -
 47
47 -
 48
48 -
 49
49 -
 50
50 -
 51
51 -
 52
52 -
 53
53 -
 54
54 -
 55
55 -
 56
56 -
 57
57 -
 58
58 -
 59
59 -
 60
60 -
 61
61 -
 62
62 -
 63
63 -
 64
64 -
65
-
66
-
67
-
68
-
69
-
70
-
71
-
72
-
73
-
74
-
75
-
76
-
77
-
78
-
79
-
80
-
81
-
82
-
83
-
84
-
85
-
86
-
87
-
88
-
89
-
90
-
91
-
92
-
93
-
94
-
95
-
96
-
97
-
98
-
99
-
100
-
101
-
102
-
103
-
104
-
105
-
106
-
107
-
108
-
109
-
110
-
111
-
112
-
113
-
114
-
115
-
116
-
117
-
118
-
119
-
120
-
121
-
122
-
123
-
124
-
125
-
126
-
127
-
128
-
129
-
130
-
131
-
132
-
133
-
134
-
135
-
136
-
137
-
138
-
139
-
140
-
141
-
142
-
143
-
144
-
145
-
146
-
147
-
148
-
149
-
150
-
151
-
152
-
153
-
154
-
155
-
156
-
157
-
158
-
159
-
160
-
161
-
162
 |
 |

50 Volvo Group 2005
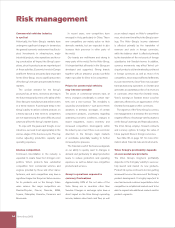
Financial position
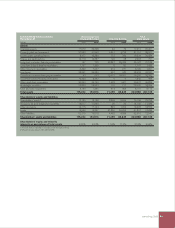
Operating net flow per currency
SEK M 2004 2005
USD 13,100 18,300
EUR 6,700 9,300
GBP 4,200 5,200
CAD 2,800 3,300
Other currencies 9,300 11,100
Total 36,100 47,200
Impact of exchange rates on
operating income
Compared with preceding year, SEK bn
Net sales1 5,3
Cost of sales (3,6)
Research and development expenses (0,1)
Selling and administrative expenses (0,6)
Other operating income and expenses (0,8)
Income from investments in shares 0
Total effect of changes in exchange
rates on operating income 0,1
1 Group sales are reported at average spot rates and
the effects of currency hedges are reported among
“Other operating income and expenses”.
due to lower pension debt as a result of capital
injections to the Group’s pension foundations.
Other financial income and expenses
were positively impacted by marked-to-market
revaluation of derivatives used for hedging of
the customer finance portfolio. The positive
revaluation impact is a result of higher long-
term interest rates in the US and Canada and
was for the full year SEK 251 M. There was
no revaluation impact in 2004, as marked-
to-market valuation was not applicable in
Swedish GAAP.
Income taxes
The income tax expense for 2005 was SEK
4,908 M corresponding to a tax rate of 27%,
compared to an income tax expense of SEK
3,129 M and a tax rate of 24% in 2004.
Income for the period
Income for the period amounted to SEK 13,106
M (9,907) corresponding to an earnings per
share of SEK 32.21 (23.58). The return on
shareholders equity was 17.8% (13.9%).
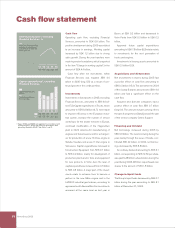
Change in net financial position
SEK bn
December 31, 2004 18.1
Cash flow from operating activities 16.1
Investments in fixed assets and
leasing assets, net (9.3)
Operating cash flow,
excluding Financial Services 6.8
Investments and divestments of shares, net 0.1
Acquired and divested operations 0.6
IFRS transition effect (3.3)
Change in provision for post-employment
benefits 4.4
Repurchase of own shares (1.8)
Dividend paid to AB Volvo’s shareholders (5.1)
Currency effect (1.6)
Other 0.5
Total change 0.6
December 31, 2005 18.7
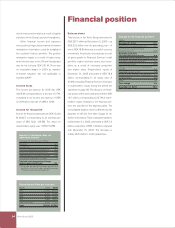
Balance sheet
Total assets in the Volvo Group amounted to
SEK 257.1 billion at December 31, 2005 – up
SEK 33.2 billion over the preceding year – of
which SEK 18.8 billion was a result of currency
movements. Assets also increased as a result
of good growth in Financial Services’ credit
portfolio, higher inventory levels and receiv-
ables as a result of increased production
and higher sales. Shareholders’ equity at
December 31, 2005 amounted to SEK 78.8
billion, corresponding to an equity ratio of
40.4%, excluding Financial Services. Changes
in shareholders’ equity during the period are
specified on page 83. The Group’s net finan-
cial assets at the same date amounted to SEK
18.7 billion, corresponding to 23.7% of share-
holders’ equity. Changes in net financial pos-
ition are specified in the adjoining table. The
consolidated balance sheet is affected by the
adoption of IAS 39. See Note 3 page 91 for
further information. Total contingent liabilities
at December 31, 2005, amounted to SEK 7.9
billion, a reduction of SEK 1.3 billion compared
with December 31, 2004. The decrease is
mainly attributable to credit guarantees.