Volvo 2005 Annual Report Download - page 153
Download and view the complete annual report
Please find page 153 of the 2005 Volvo annual report below. You can navigate through the pages in the report by either clicking on the pages listed below, or by using the keyword search tool below to find specific information within the annual report.-
 1
1 -
2
-
3
-
4
-
5
-
6
-
7
-
8
-
9
-
10
-
11
-
12
-
13
-
14
-
15
-
16
-
17
-
18
-
19
-
20
-
21
-
22
-
23
-
24
-
25
-
26
-
27
-
28
-
29
-
30
-
31
-
32
-
33
-
34
-
35
-
36
-
37
-
38
-
39
-
40
-
41
-
42
-
43
-
44
-
45
-
46
-
47
-
48
-
49
-
50
-
51
-
52
-
53
-
54
-
55
-
56
-
57
-
58
-
59
-
60
-
61
-
62
-
63
-
64
-
65
-
66
-
67
-
68
-
69
-
70
-
71
-
72
-
73
-
74
-
75
-
76
-
77
-
78
-
79
-
80
-
81
-
82
-
83
-
84
-
85
-
86
-
87
-
88
-
89
-
90
-
91
-
92
-
93
-
94
-
95
-
96
-
97
-
98
-
99
-
100
-
101
-
102
-
103
-
104
-
105
-
106
-
107
-
108
-
109
-
110
-
111
-
112
-
113
-
114
-
115
-
116
-
117
-
118
-
119
-
120
-
121
-
122
-
123
-
124
-
125
-
126
-
127
-
128
-
129
-
130
-
131
-
132
-
133
-
134
-
135
-
136
-
137
-
138
-
139
-
140
-
141
-
142
-
 143
143 -
 144
144 -
 145
145 -
 146
146 -
 147
147 -
 148
148 -
 149
149 -
 150
150 -
 151
151 -
 152
152 -
 153
153 -
 154
154 -
 155
155 -
 156
156 -
 157
157 -
 158
158 -
 159
159 -
 160
160 -
 161
161 -
 162
162
 |
 |
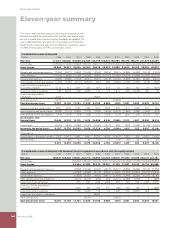
Volvo Group 2005 149
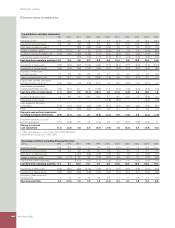
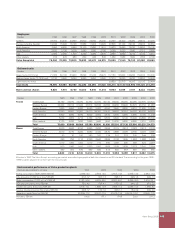
Exports from Sweden
SEK M 1995 1996 1997 1998 1999 2000 2001 2002 2003 2004 2005
Volvo Group, total 56,059 54,589 58,569 64,401 52,719 46,251 50,394 52,730 49,300 62,653 71,133
Key ratios
1995 1996 1997 1998 1999 2000 2001 2002 2003 2004 2005
Gross margin %
1 25.1 22.3 24.4 23.2 20.3 19.3 17.2 17.9 19.2 21.6 21.8
Research and development expenses
as percentage of net sales1 4.3 5.3 4.9 4.9 3.9 4.1 3.0 3.3 3.9 3.8 3.3
Selling expenses as percent
of net sales1 10.2 9.5 9.4 9.0 7.0 7.7 8.1 8.7 9.1 9.1 8.5
Administration expenses as
percentage of net sales1 4.3 4.3 3.9 3.9 4.0 3.9 3.6 3.1 3.0 2.6 2.7
Return on shareholders’ equity, % 19.3 23.7 17.2 13.0 34.9 5.0 neg 1.7 0.4 13.9 17.8
Interest coverage, times 4.6 5.5 5.8 9.6 23.1 4.5 neg 2.2 1.9 11.0 16.7
Self-fi nancing ratio, % 128 26 27 16 29 39 92 110 152 163 116
Self-fi nancing ratio
excluding Financial Services, % 190 87 184 105 130 72 148 196 243 268 173
Net fi nancial position, SEK M 201 10,672 16,956 12,232 28,758 9,392 (7,042) (6,063) (2,426) 18,110 18,675
Net fi nancial position as
percentage of shareholders’
equity and minority interests 0.4 18.3 27.0 17.4 29.3 10.6 (8.2) (7.7) (3.3) 25.8 23.7
Shareholders’ equity as percentage
of total assets 37.4 41.4 38.1 34.1 50.2 44.3 32.8 32.8 31.4 31.3 30.6
Shareholders’ equity as percentage
of total assets, excluding
Financial Services 41.9 49.4 53.1 51.2 67.3 60.8 41.8 42.4 40.5 40.0 40.4
Shareholders’ equity excluding minority
interest as percentage of total assets 36.9 41.0 37.6 33.7 49.9 44.0 32.6 32.7 31.3 31.2 30.5
1 1995–1996 including Financial Services. As from 1997 Financial Services
is accounted by the equity method.