Volvo 2005 Annual Report Download - page 160
Download and view the complete annual report
Please find page 160 of the 2005 Volvo annual report below. You can navigate through the pages in the report by either clicking on the pages listed below, or by using the keyword search tool below to find specific information within the annual report.-
 1
1 -
2
-
3
-
4
-
5
-
6
-
7
-
8
-
9
-
10
-
11
-
12
-
13
-
14
-
15
-
16
-
17
-
18
-
19
-
20
-
21
-
22
-
23
-
24
-
25
-
26
-
27
-
28
-
29
-
30
-
31
-
32
-
33
-
34
-
35
-
36
-
37
-
38
-
39
-
40
-
41
-
42
-
43
-
44
-
45
-
46
-
47
-
48
-
49
-
50
-
51
-
52
-
53
-
54
-
55
-
56
-
57
-
58
-
59
-
60
-
61
-
62
-
63
-
64
-
65
-
66
-
67
-
68
-
69
-
70
-
71
-
72
-
73
-
74
-
75
-
76
-
77
-
78
-
79
-
80
-
81
-
82
-
83
-
84
-
85
-
86
-
87
-
88
-
89
-
90
-
91
-
92
-
93
-
94
-
95
-
96
-
97
-
98
-
99
-
100
-
101
-
102
-
103
-
104
-
105
-
106
-
107
-
108
-
109
-
110
-
111
-
112
-
113
-
114
-
115
-
116
-
117
-
118
-
119
-
120
-
121
-
122
-
123
-
124
-
125
-
126
-
127
-
128
-
129
-
130
-
131
-
132
-
133
-
134
-
135
-
136
-
137
-
138
-
139
-
140
-
141
-
142
-
143
-
144
-
145
-
146
-
147
-
148
-
149
-
 150
150 -
 151
151 -
 152
152 -
 153
153 -
 154
154 -
 155
155 -
 156
156 -
 157
157 -
 158
158 -
 159
159 -
 160
160 -
 161
161 -
 162
162
 |
 |

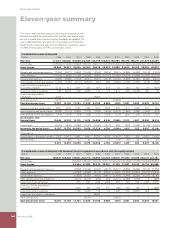
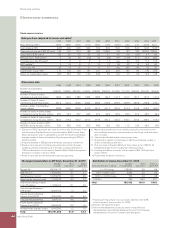
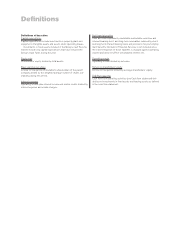
Defi nitions
Definitions of key ratios
Capital expenditures
Capital expenditures include investments in property, plant and
equipment, intangible assets and assets under operating leases.
Investments in fixed assets included in the Group’s cash flow sta-
tement include only capital expenditures that have reduced the
Group’s liquid funds during the year.
Equity ratio
Shareholders’ equity divided by total assets.
Basic earnings per share
Income for the period attributable to shareholders of the parent
company divided by the weighted average number of shares out-
standing during the period.
Interest coverage
Operating income plus interest income and similar credits divided by
interest expense and similar charges.
Net financial position
Cash and cash equivalents, marketable marketable securities and
interest-bearing short- and long-term receivables reduced by short-
and long-term interest-bearing loans and provisions for post-employ-
ment benefits. Net debt in Financial Services is not included since
the interest expense on these liabilities is charged against operating
income and does not affect consolidated interest net.
Operating margin
Operating income divided by net sales.
Return on shareholders’ equity
Income for the period divided by average shareholders’ equity.
Self-financing ratio
Cash flow from operating activities (see Cash flow statement) divi-
ded by net investments in fixed assets and leasing assets as defined
in the cash flow statement.
≥