Volvo 2005 Annual Report Download - page 143
Download and view the complete annual report
Please find page 143 of the 2005 Volvo annual report below. You can navigate through the pages in the report by either clicking on the pages listed below, or by using the keyword search tool below to find specific information within the annual report.-
 1
1 -
2
-
3
-
4
-
5
-
6
-
7
-
8
-
9
-
10
-
11
-
12
-
13
-
14
-
15
-
16
-
17
-
18
-
19
-
20
-
21
-
22
-
23
-
24
-
25
-
26
-
27
-
28
-
29
-
30
-
31
-
32
-
33
-
34
-
35
-
36
-
37
-
38
-
39
-
40
-
41
-
42
-
43
-
44
-
45
-
46
-
47
-
48
-
49
-
50
-
51
-
52
-
53
-
54
-
55
-
56
-
57
-
58
-
59
-
60
-
61
-
62
-
63
-
64
-
65
-
66
-
67
-
68
-
69
-
70
-
71
-
72
-
73
-
74
-
75
-
76
-
77
-
78
-
79
-
80
-
81
-
82
-
83
-
84
-
85
-
86
-
87
-
88
-
89
-
90
-
91
-
92
-
93
-
94
-
95
-
96
-
97
-
98
-
99
-
100
-
101
-
102
-
103
-
104
-
105
-
106
-
107
-
108
-
109
-
110
-
111
-
112
-
113
-
114
-
115
-
116
-
117
-
118
-
119
-
120
-
121
-
122
-
123
-
124
-
125
-
126
-
127
-
128
-
129
-
130
-
131
-
132
-
 133
133 -
 134
134 -
 135
135 -
 136
136 -
 137
137 -
 138
138 -
 139
139 -
 140
140 -
 141
141 -
 142
142 -
 143
143 -
 144
144 -
 145
145 -
 146
146 -
 147
147 -
 148
148 -
 149
149 -
 150
150 -
 151
151 -
 152
152 -
 153
153 -
154
-
155
-
156
-
157
-
158
-
159
-
160
-
161
-
162
 |
 |
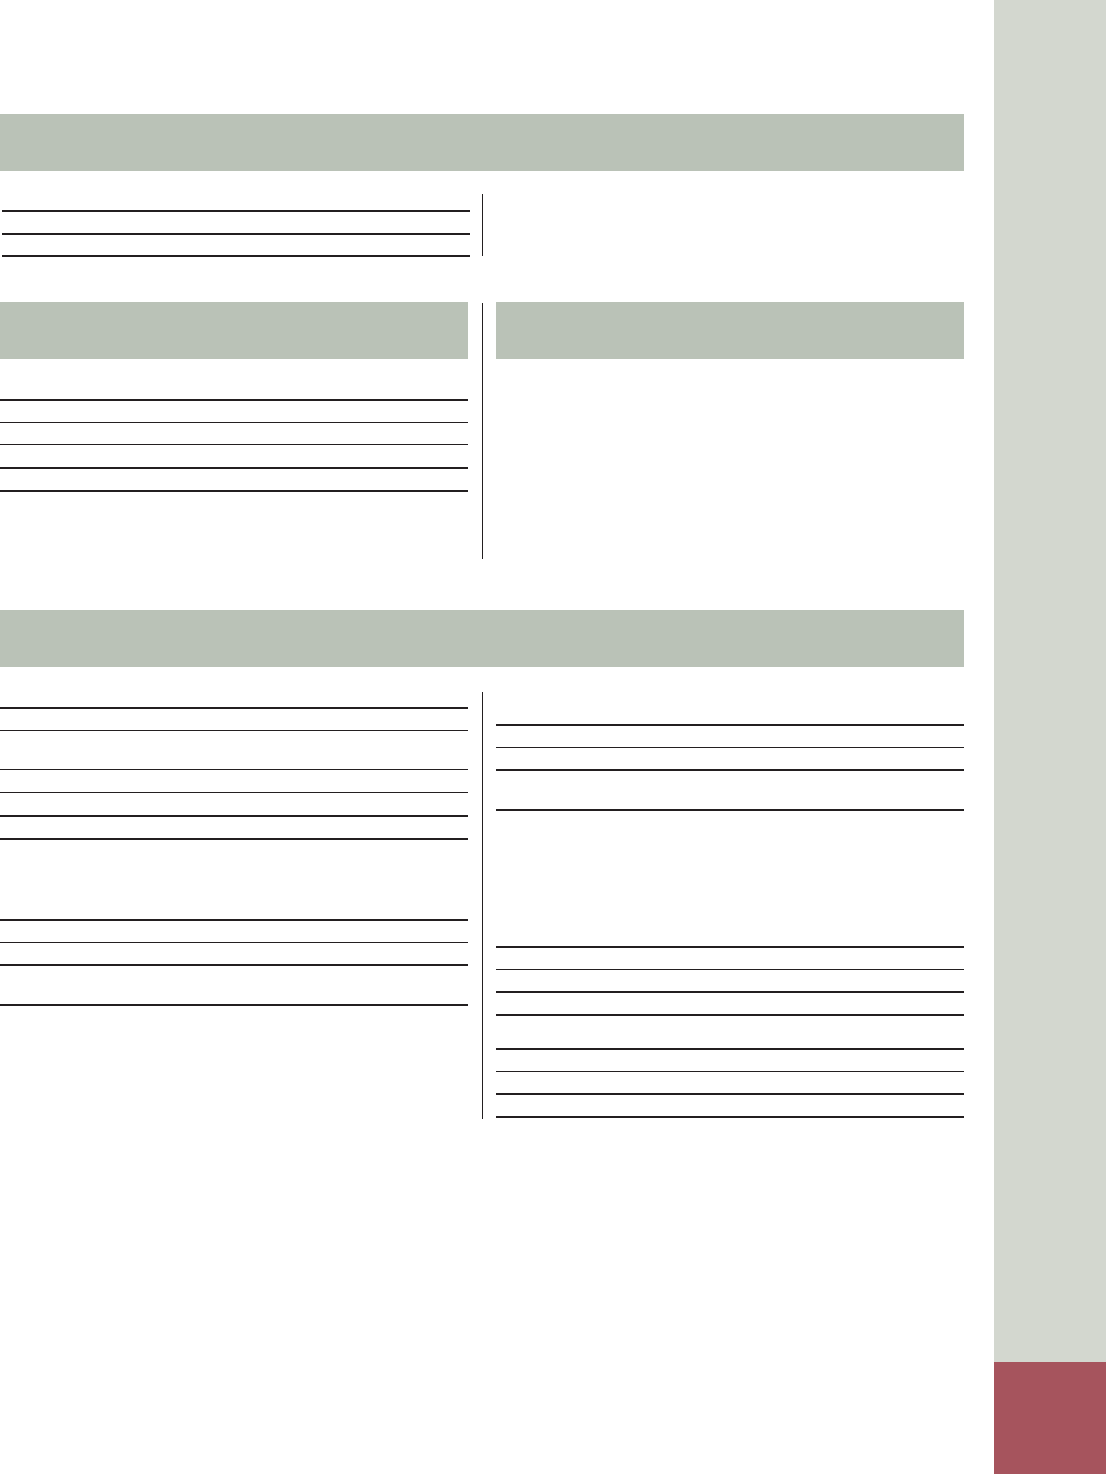
Volvo Group 2005 139
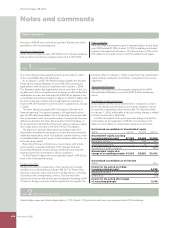
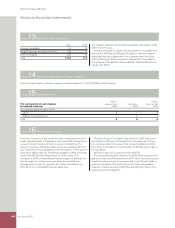
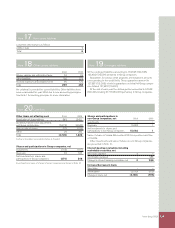
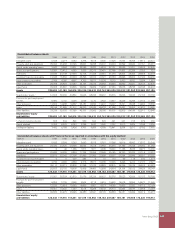
Note 18 Other current liabilities
2004 2005
Wages, salaries and withholding taxes 53 59
Other liabilities 156 279
Accrued expenses and prepaid income 90 120
Total 299 458
No collateral is provided for current liabilities. Other liabilities have
been recalculated for year 2004 due to new accounting principles.
See Note 1 Accounting principles for more information.
Note 19 Contingent liabilities
Of the contingent liabilities amounting to 133,595 (120,738),
133,462 (120,591) pertained to Group companies.
Guarantees for various credit programs are included in amounts
corresponding to the credit limits. These guarantees amount to
127,987 (115,266), of which guarantees on behalf of Group compa-
nies totaled 127,982 (115,261).
At the end of each year, the utilized portion amounted to 67,908
(53,142) including 67,776 (53,130) pertaining to Group companies.
Note 20 Cash fl ow
Other items not affecting cash 2004 2005
Revaluation of shareholdings 545 8,421
Dividends, transfer price adjustments
and Group contributions (5,273) (6,940)
Gain on sale of shares (27) (519)
Other 29 260
Total (4,726) 1,222
Further information is provided in Notes 4, 5 and 6.
Shares and participations in Group companies, net
Investments (703) (197)
Disposals 33 545
Net investments in shares and
participations in Group companies (670) 348
Investments and sales of shares in Group companies are shown in Note 12.
Shares and participations in
non-Group companies, net 2004 2005
Investments – –
Disposals 15,082 1
Net investments in shares and
participations in non-Group companies 15,082 1
Sales of shares in Scania AB resulted 2004 in a positive cash fl ow
of 15,029.
Other investments and sales of shares in non-Group companies
are presented in Note 12.
Interest-bearing receivables including
marketable securities, net
New loans granted 0 –
Amortization received – 988
Change in interest-bearing receivables, net 0 988
Increase/decrease in loans
New loans – –
Amortization (3,180) (975)
Change in loans, net (3,180) (975)
Note 17 Non-current liabilities
Long-term debt matures as follows:
2009 or later 6
Total 6