Volvo 2005 Annual Report Download - page 154
Download and view the complete annual report
Please find page 154 of the 2005 Volvo annual report below. You can navigate through the pages in the report by either clicking on the pages listed below, or by using the keyword search tool below to find specific information within the annual report.-
 1
1 -
2
-
3
-
4
-
5
-
6
-
7
-
8
-
9
-
10
-
11
-
12
-
13
-
14
-
15
-
16
-
17
-
18
-
19
-
20
-
21
-
22
-
23
-
24
-
25
-
26
-
27
-
28
-
29
-
30
-
31
-
32
-
33
-
34
-
35
-
36
-
37
-
38
-
39
-
40
-
41
-
42
-
43
-
44
-
45
-
46
-
47
-
48
-
49
-
50
-
51
-
52
-
53
-
54
-
55
-
56
-
57
-
58
-
59
-
60
-
61
-
62
-
63
-
64
-
65
-
66
-
67
-
68
-
69
-
70
-
71
-
72
-
73
-
74
-
75
-
76
-
77
-
78
-
79
-
80
-
81
-
82
-
83
-
84
-
85
-
86
-
87
-
88
-
89
-
90
-
91
-
92
-
93
-
94
-
95
-
96
-
97
-
98
-
99
-
100
-
101
-
102
-
103
-
104
-
105
-
106
-
107
-
108
-
109
-
110
-
111
-
112
-
113
-
114
-
115
-
116
-
117
-
118
-
119
-
120
-
121
-
122
-
123
-
124
-
125
-
126
-
127
-
128
-
129
-
130
-
131
-
132
-
133
-
134
-
135
-
136
-
137
-
138
-
139
-
140
-
141
-
142
-
143
-
 144
144 -
 145
145 -
 146
146 -
 147
147 -
 148
148 -
 149
149 -
 150
150 -
 151
151 -
 152
152 -
 153
153 -
 154
154 -
 155
155 -
 156
156 -
 157
157 -
 158
158 -
 159
159 -
 160
160 -
 161
161 -
 162
162
 |
 |
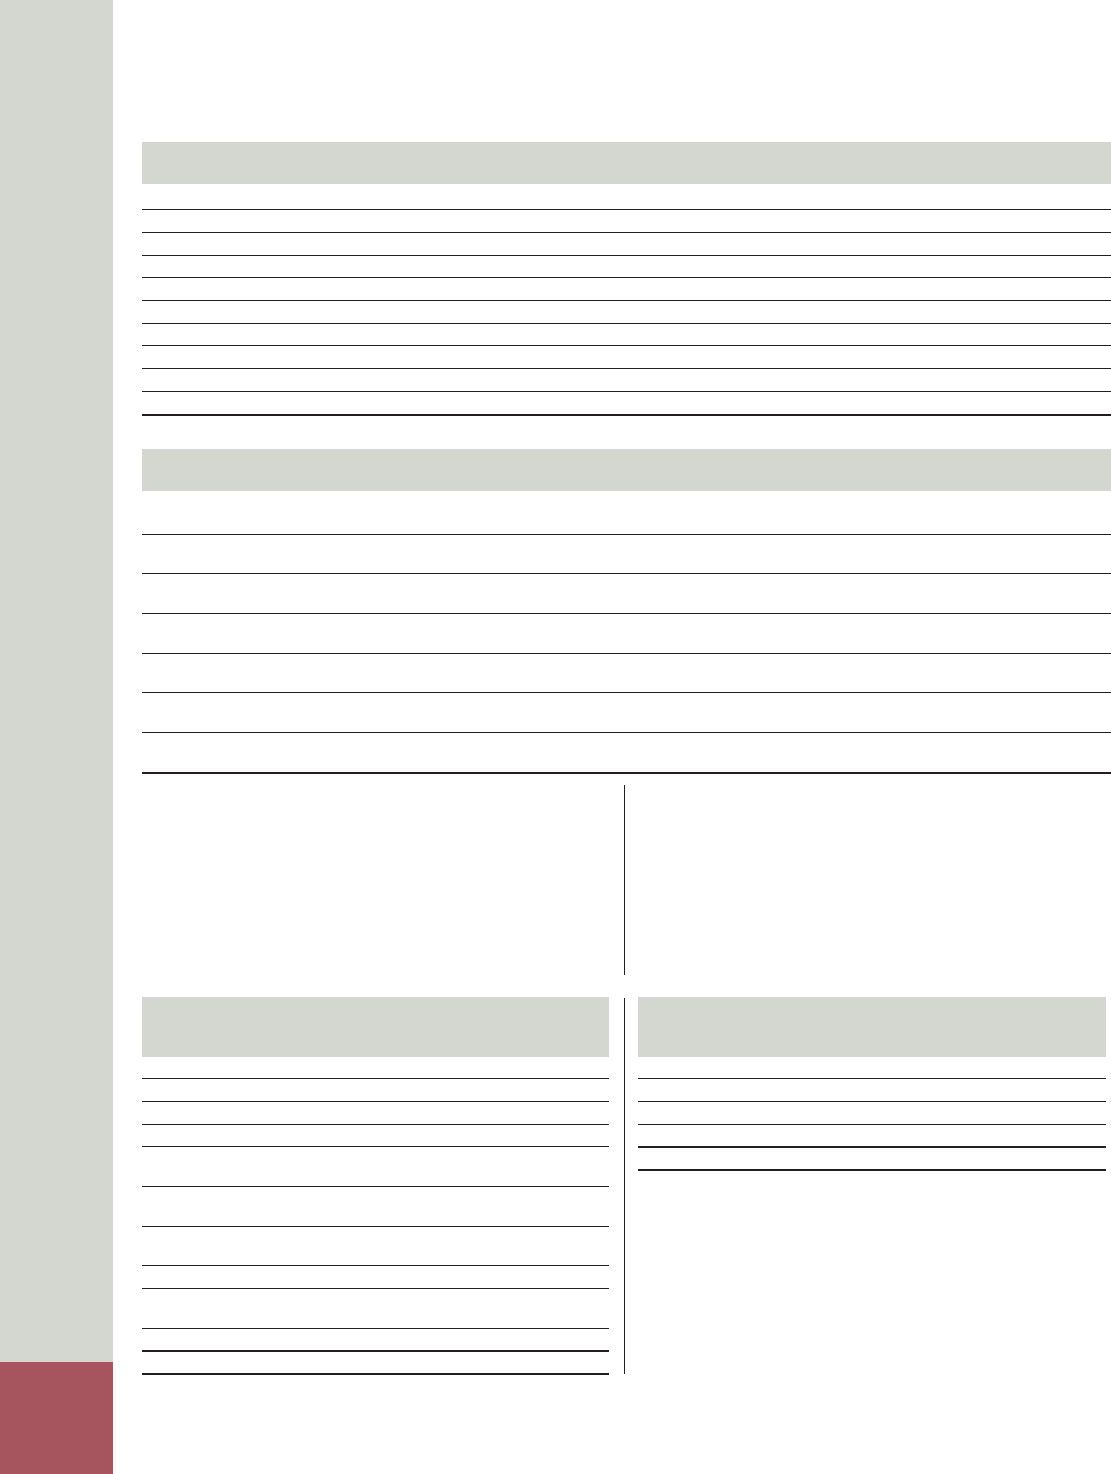
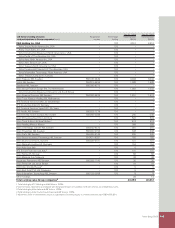
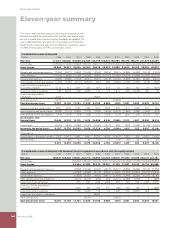
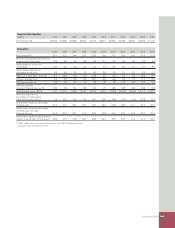
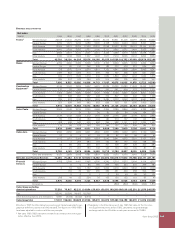
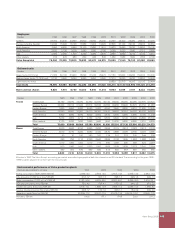
Eleven-year summary
150 Volvo Group 2005
Data per share (adjusted for issues and splits)1
1995 1996 1997 1998 1999 2000 2001 2002 2003 2004 2005
Basic earnings, SEK
1 20.20 26.90 23.20 19.10 73.00 11.20 (3.50) 3.32 0.71 23.58 32.21
Cash dividend, SEK 4.00
8 4.30 5.00 6.00 7.00 8.00 8.00 8.00 8.00 12.50 16.75
10
Share price at year-end, SEK (B share) 136 151 213 186 220 156.50 176 142 220 263.50 374.50
Direct return, % (B share)
2 2.9 2.9 2.3 3.2 3.2 5.1 4.5 5.6 10.5
9 4.7 4.5
Effective return, % (B share)
3 0 30 46 (10) 22 (23) 17.6 (14.8) 71.2 25.5 48.5
Price/earnings ratio (B share)
4 7 6 9 9 3 14 neg 43 310 11.2 11.6
EBIT multiple
5 7 16 9 11 10 10 25 23 14 9.2 9.3
Payout ratio, %
6 20 16 22 31 10 71 neg 242 1,143 53 52
Shareholders’ equity, SEK
7 110 125 140 157 221 222 203 187 173 170 194
Return on shareholders’ equity 19.3 23.7 17.2 13.0 34.9 5.0 neg 1.7 0.4 13.9 17.8
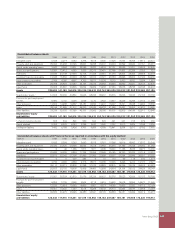
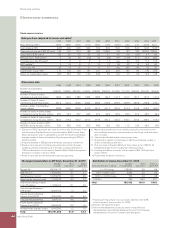
VOLVO SHARE STATISTICS
Other share data
1995 1996 1997 1998 1999 2000 2001 2002 2003 2004 2005
Number of shareholders
at year-end 206,700 176,800 225,500 210,600 238,000 230,000 214,000 211,000 208,500 202,300 195,442
Number of Series A shares
outstanding at year-end, millions 142.2 142.2 138.6 138.6 138.6 124.7 131.7 131.7 131.7 131.5 131.4
Number of Series B shares
outstanding at year-end, millions 321.4 321.4 302.9 302.9 302.9 272.6 287.8 287.8 287.8 278.6 273.1
Average number of outstanding
shares, millions 458.9 463.6 452.5 441.5 441.5 421.7 422.4 419.4 419.4 418.5 405.2
Number of Series A shares traded
in Stockholm during the year, millions 23.2 23.7 23.7 34.5 27.0 42.4 40.3 27.3 31.4 42.0 39.3
Number of Series B shares traded
in Stockholm during the year, millions 363.3 316.4 362.7 371.3 479.6 391.2 344.4 349.4 404.8 498.0 518.7
Number of shares traded in ADR,
NASDAQ during the year, millions 73.5 83.0 51.8 50.5 54.9 16.0 15.0 11.0 10.4 24.0 19.8
1 Effective in 1997, adjustment was made to conform with the Swedish Finan-
cial Accounting Standard Council’s recommendation, RR9, Income Taxes.
Basic earnings per share is calculated as income for the period divided by
average number of shares outstanding. Reporting according to IFRS for
2004 and 2005.
2 Proposed dividend in SEK per share divided by share price at year-end.
3 Share price at year-end, including proposed dividend during the year,
divided by share price at beginning of the year, including redemption in
1997 and distribution of one share of Swedish Match 1996 and proposed
distribution of shares in Ainax in 2004.
4 Share price at year-end divided by basic earnings per share.
5 Market value at year-end minus net fi nancial position and minority inter-
ests divided by operating income excluding restructuring costs and revalu-
ation of shares.
6 Cash dividend divided by basic earnings per share.
7 Shareholders’ equity for shareholders in AB Volvo divided by number of
shares outstanding at year-end.
8 Plus one share of Swedish Match per Volvo share, price of SEK 21.74
(weighted average fi rst ten trading days following listing).
9 Including distribution of shares in Ainax equal to SEK 15.05 per Volvo
share in 2004.
10 Proposed by the Board of Directors.
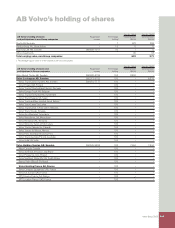
The largest shareholders in AB Volvo, December 31, 2005
1
Number % of Share
of shares total votes
2 capital, %
2
Renault SA 88,304,177 20.5 20.7
AMF Pension 17,587,800 4.1 4.1
Alecta (pension funds) 12,793,709 2.9 3.0
Robur fonder (savings funds) 11,675,743 4.2 2.7
SEB fonder (savings funds)/
Trygg Försäkring 11,649,314 6.1 2.7
Svenska Handelsbanken/
SPP fonder 9,637,193 1.4 2.3
Second Swedish National
Pension Fund (AP2) 8,351,835 4.6 2.0
Svenska Handelsbanken3 7,867,109 4.6 1.8
Fourth Swedish National
Pension Fund (AP4) 6,504,195 2.3 1.5
Nordea fonder (savings funds) 6,420,290 1.2 1.5
Total 180,791,365 51.9 42.3
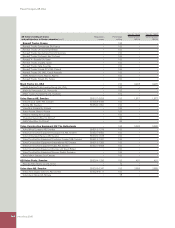
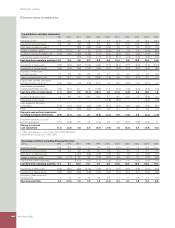
Distribution of shares, December 31, 2005
Number % of Share of
Volvo shareholders
1 holding of shareholders total votes
2 capital, % 2
1–1,000 shares 185,090 5.9 6.8
1,001–10,000 shares 9,384 4.2 5.3
10,001–100,000 shares 703 3.4 4.8
100,001– 265 86.5 83.1
Total 195,442 100.0 100.0
1 Following the repurchase of its own shares, AB Volvo held 5.0%
of the Company´s shares on Dec. 31, 2005.
2 Based on all registered shares.
3 Svenska Handelsbanken comprises shares held by Svenska
Handelsbanken, Svenska Handelsbanken Pension Fund, Svenska
Handelsbanken Personnel Foundation and Oktogonen.
Eleven-year summary