Volvo 2005 Annual Report Download - page 124
Download and view the complete annual report
Please find page 124 of the 2005 Volvo annual report below. You can navigate through the pages in the report by either clicking on the pages listed below, or by using the keyword search tool below to find specific information within the annual report.-
 1
1 -
2
-
3
-
4
-
5
-
6
-
7
-
8
-
9
-
10
-
11
-
12
-
13
-
14
-
15
-
16
-
17
-
18
-
19
-
20
-
21
-
22
-
23
-
24
-
25
-
26
-
27
-
28
-
29
-
30
-
31
-
32
-
33
-
34
-
35
-
36
-
37
-
38
-
39
-
40
-
41
-
42
-
43
-
44
-
45
-
46
-
47
-
48
-
49
-
50
-
51
-
52
-
53
-
54
-
55
-
56
-
57
-
58
-
59
-
60
-
61
-
62
-
63
-
64
-
65
-
66
-
67
-
68
-
69
-
70
-
71
-
72
-
73
-
74
-
75
-
76
-
77
-
78
-
79
-
80
-
81
-
82
-
83
-
84
-
85
-
86
-
87
-
88
-
89
-
90
-
91
-
92
-
93
-
94
-
95
-
96
-
97
-
98
-
99
-
100
-
101
-
102
-
103
-
104
-
105
-
106
-
107
-
108
-
109
-
110
-
111
-
112
-
113
-
 114
114 -
 115
115 -
 116
116 -
 117
117 -
 118
118 -
 119
119 -
 120
120 -
 121
121 -
 122
122 -
 123
123 -
 124
124 -
 125
125 -
 126
126 -
 127
127 -
 128
128 -
 129
129 -
 130
130 -
 131
131 -
 132
132 -
 133
133 -
 134
134 -
135
-
136
-
137
-
138
-
139
-
140
-
141
-
142
-
143
-
144
-
145
-
146
-
147
-
148
-
149
-
150
-
151
-
152
-
153
-
154
-
155
-
156
-
157
-
158
-
159
-
160
-
161
-
162
 |
 |

The Volvo Group
120 Volvo Group 2005
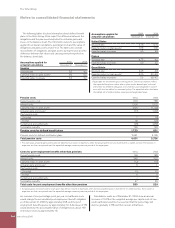
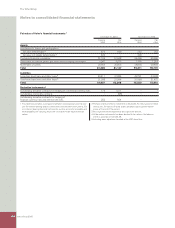
2004 2005
Wages, salaries and other of which of which
remunerations, Board and variable Other Board and variable Other
SEK M Presidents 1 salaries employees Presidents 1 salaries employees
AB Volvo
Sweden 33.4 11.6 106.3 42.8 9.8 97.9
Subsidaries
Sweden 79.3 15.5 9,041.7 84.6 15.6 9,475.6
Western Europe 442.3 10.9 8,905.3 436.0 6.3 9,267.6
Eastern Europe 14.5 0.2 367.0 25.2 2.0 472.9
North America 209.1 10.2 5,292.7 199.4 17.9 5,965.5
South America 7.2 0.0 363.9 9.3 0.0 529.4
Asia 49.9 0.7 724.9 58.9 1.0 957.2
Other countries 12.7 0 394.5 26.7 0 467.5
Group total 848.4 49.1 25,196.3 882.9 52.6 27,233.6
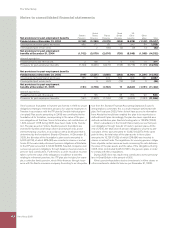
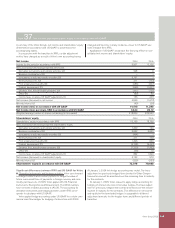
2004 2005
Wages, salaries, other Wages, Wages,
remunerations and salaries, Social of which salaries, Social of which
social costs, SEK M remunerations costs pens. costs remunerations costs pens. costs
AB Volvo
2 139.7 80.7 48.7 140.7 78.6 46.7
Subsidiaries 25,905.0 10,964.8 4,365.2 27,975.9 10,392.1 3,688.9
Group total
3 26,044.7 11,045.5 4,413.9 28,116.5 10,470.7 3,735.6
1 Including current and former Board members, Presidents and Executive
Vice Presidents.
2 The Parent Company’s pension costs, pertaining to Board members and
Presidents are disclosed in Note 22 in the Parent Company.
3 Of the Group’s pension costs, 125.5 (157.8) pertain to Board members
and Presidents. The Group’s outstanding pension obligations to these indi-
viduals amount to 573.8 (838.3).
The cost for non-monetary benefi ts in the Group amounted to
1,055.9, of which 47.6 to Board members and presidents. The cost
for non-monetary benefi ts in the Parent company amount to 14.6,
of which 3.7 to Board members and presidents.
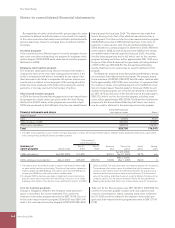
Note 35 Fees to the auditors
Audit fees 2004 2005
Audit fees to PricewaterhouseCoopers 78 78
Audit fees to other audit fi rms 2 1
Total 80 79
Other fees to
PricewaterhouseCoopers
Fees for audit related services 20 28
Fees for tax services 16 17
Total 36 45
Fees and other remuneration to
external auditors total 116 124
Auditing assignments involve examination of the annual report and
fi nancial accounting and the administration by the Board and the
President, other tasks related to the duties of a company auditor and
consultation or other services that may result from observations
noted during such examination or implementation of such other
tasks. All other tasks are defi ned as other assignments.
Other fees in 2003 to PricewaterhouseCoopers amounted to 64.
Notes to consolidated fi nancial statements