Volvo 2005 Annual Report Download - page 104
Download and view the complete annual report
Please find page 104 of the 2005 Volvo annual report below. You can navigate through the pages in the report by either clicking on the pages listed below, or by using the keyword search tool below to find specific information within the annual report.-
 1
1 -
2
-
3
-
4
-
5
-
6
-
7
-
8
-
9
-
10
-
11
-
12
-
13
-
14
-
15
-
16
-
17
-
18
-
19
-
20
-
21
-
22
-
23
-
24
-
25
-
26
-
27
-
28
-
29
-
30
-
31
-
32
-
33
-
34
-
35
-
36
-
37
-
38
-
39
-
40
-
41
-
42
-
43
-
44
-
45
-
46
-
47
-
48
-
49
-
50
-
51
-
52
-
53
-
54
-
55
-
56
-
57
-
58
-
59
-
60
-
61
-
62
-
63
-
64
-
65
-
66
-
67
-
68
-
69
-
70
-
71
-
72
-
73
-
74
-
75
-
76
-
77
-
78
-
79
-
80
-
81
-
82
-
83
-
84
-
85
-
86
-
87
-
88
-
89
-
90
-
91
-
92
-
93
-
 94
94 -
 95
95 -
 96
96 -
 97
97 -
 98
98 -
 99
99 -
 100
100 -
 101
101 -
 102
102 -
 103
103 -
 104
104 -
 105
105 -
 106
106 -
 107
107 -
 108
108 -
 109
109 -
 110
110 -
 111
111 -
 112
112 -
 113
113 -
 114
114 -
115
-
116
-
117
-
118
-
119
-
120
-
121
-
122
-
123
-
124
-
125
-
126
-
127
-
128
-
129
-
130
-
131
-
132
-
133
-
134
-
135
-
136
-
137
-
138
-
139
-
140
-
141
-
142
-
143
-
144
-
145
-
146
-
147
-
148
-
149
-
150
-
151
-
152
-
153
-
154
-
155
-
156
-
157
-
158
-
159
-
160
-
161
-
162
 |
 |

The Volvo Group
100 Volvo Group 2005
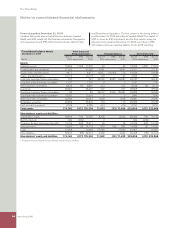
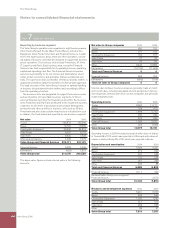
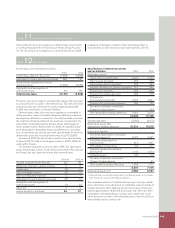
Reporting by business segment
The Volvo Group’s operations are organized in eight business areas:
Volvo Trucks, Renault Trucks, Mack Trucks, Buses, Construction
Equipment, Volvo Penta, Volvo Aero and Financial Services. In addi-
tion to the eight business areas, there are other operations consist-
ing mainly of business units that are designed to support the business
areas’ operations. The business units include Powertrain, 3P, Volvo
IT, Logistics and Parts. Each business area, except for Financial
Services, has total responsibility for its operating income, operating
capital and operating cash fl ow. The Financial Services business
area has responsibility for its net income and total balance sheet
within certain restrictions and principles that are established cen-
trally. The supervision and coordination of treasury and tax matters is
organized centrally to obtain the benefi ts of a Group-wide approach.
The legal structure of the Volvo Group is based on optimal handling
of treasury, tax and administrative matters and, accordingly, differs
from the operating structure.
The business units are designated to support the business areas
and are therefore not reportable business segments. In Volvo’s
external fi nancial reporting, the fi nancial results within the business
units Powertrain and Parts are distributed to the respective business
segments. As the three truck brands share product development,
production and other activities in business units such as 3P and
Powertrain and also share certain infrastructure in distribution such
as dealers, the truck brands are reported as one business segment.
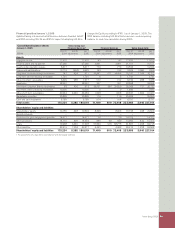
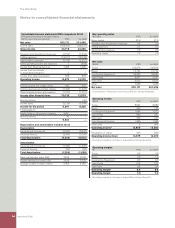
Net sales 2004 2005
Trucks 136,879 155,396
Buses 12,722 16,589
Construction Equipment 29,360 34,816
Volvo Penta 9,057 9,776
Volvo Aero 6,925 7,538
Other and eliminations 7,228 7,076
Volvo Group excl Financial Services 202,171 231,191
Financial Services 9,598 7,549
Eliminations (693) 1,819
Volvo Group total 211,076 240,559
The above sales fi gures include internal sales in the following
amounts:
Net sales to Group companies 2004 2005
Trucks 690 752
Buses 377 102
Construction Equipment 162 127
Volvo Penta 27 42
Volvo Aero 43 82
Other 9,440 10,589
Eliminations (10,739) (11,694)
Total excl Financial Services 0 0
Financial Services 693 755
Eliminations (693) (755)
Total net sales to Group companies 0 0
Internal sales between business areas are generally made at stand-
ard cost of sales, including calculated interest and product improve-
ment expenses. Internal sales from service companies are generally
made at market prices.
Operating income 2004 2005
Trucks 8,992 11,717
Buses 158 470
Construction Equipment 1,898 2,752
Volvo Penta 940 943
Volvo Aero 403 836
Financial Services 1,365 2,033
Other 923 (600)
Volvo Group total 14,679 18,151
Operating income in 2004 included reversal of write-down of shares
in Scania AB of 915, which was reported in Other and write-down of
shares in Henlys Group Plc of 95, which was reported in Buses.
Depreciation and amortization 2004 2005
Trucks 5,306 5,307
Buses 219 249
Construction Equipment 627 658
Volvo Penta 122 224
Volvo Aero 391 366
Other 220 88
Total excl Financial Services 6,885 6,892
Financial Services 3,117 429
Reclassifi cation Group versus segment
Financial Services – 2,573
Volvo Group total 10,002 9,894
Research and development expenses 2004 2005
Trucks 5,491 5,200
Buses 484 569
Construction Equipment 1,033 1,083
Volvo Penta 311 413
Volvo Aero 209 225
Other 86 67
Volvo Group total 7,614 7,557
Notes to consolidated fi nancial statements
Note 7 Segment reporting