Volvo 2005 Annual Report Download - page 155
Download and view the complete annual report
Please find page 155 of the 2005 Volvo annual report below. You can navigate through the pages in the report by either clicking on the pages listed below, or by using the keyword search tool below to find specific information within the annual report.-
 1
1 -
2
-
3
-
4
-
5
-
6
-
7
-
8
-
9
-
10
-
11
-
12
-
13
-
14
-
15
-
16
-
17
-
18
-
19
-
20
-
21
-
22
-
23
-
24
-
25
-
26
-
27
-
28
-
29
-
30
-
31
-
32
-
33
-
34
-
35
-
36
-
37
-
38
-
39
-
40
-
41
-
42
-
43
-
44
-
45
-
46
-
47
-
48
-
49
-
50
-
51
-
52
-
53
-
54
-
55
-
56
-
57
-
58
-
59
-
60
-
61
-
62
-
63
-
64
-
65
-
66
-
67
-
68
-
69
-
70
-
71
-
72
-
73
-
74
-
75
-
76
-
77
-
78
-
79
-
80
-
81
-
82
-
83
-
84
-
85
-
86
-
87
-
88
-
89
-
90
-
91
-
92
-
93
-
94
-
95
-
96
-
97
-
98
-
99
-
100
-
101
-
102
-
103
-
104
-
105
-
106
-
107
-
108
-
109
-
110
-
111
-
112
-
113
-
114
-
115
-
116
-
117
-
118
-
119
-
120
-
121
-
122
-
123
-
124
-
125
-
126
-
127
-
128
-
129
-
130
-
131
-
132
-
133
-
134
-
135
-
136
-
137
-
138
-
139
-
140
-
141
-
142
-
143
-
144
-
 145
145 -
 146
146 -
 147
147 -
 148
148 -
 149
149 -
 150
150 -
 151
151 -
 152
152 -
 153
153 -
 154
154 -
 155
155 -
 156
156 -
 157
157 -
 158
158 -
 159
159 -
 160
160 -
 161
161 -
 162
162
 |
 |

Volvo Group 2005 151
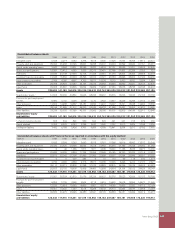
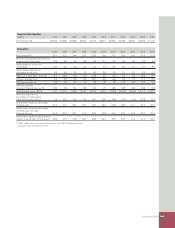
Net sales
SEK M 1995 1996 1997 1998 1999 2000 2001 2002 2003 2004 2005
Trucks1 Western Europe 22,548 21,244 22,280 27,837 30,006 30,415 60,841 61,406 63,097 68,664 70,567
Eastern Europe 1,299 1,721 2,274 3,089 2,265 3,158 5,526 6,424 7,004 8,767 9,139
North America 13,069 8,510 12,206 17,659 22,303 17,048 33,630 33,721 28,151 35,154 46,129
South America 4,641 2,759 3,832 3,777 2,190 3,111 3,993 3,277 3,464 5,223 7,657
Asia 2,863 2,577 2,410 2,047 2,010 3,432 4,659 5,919 9,206 12,378 13,551
Other markets 1,330 1,443 1,503 1,267 1,492 1,911 7,919 8,005 6,047 6,693 8,353
Total 45,750 38,254 44,505 55,676 60,266 59,075 116,568 118,752 116,969 136,879 155,396
Buses Western Europe 4,709 4,660 5,082 5,528 5,735 6,767 6,263 6,695 6,153 6,422 6,564
Eastern Europe 34 80 190 366 226 182 373 409 381 526 578
North America 736 1,575 2,314 5,574 6,871 7,723 6,847 3,838 2,984 2,960 4,247
South America 1,087 853 1,002 910 469 732 757 366 329 521 2,641
Asia 844 1,112 1,562 1,519 943 1,269 1,839 2,022 1,447 1,632 1,612
Other markets 285 247 432 389 469 514 596 705 684 661 947
Total 7,695 8,527 10,582 14,286 14,713 17,187 16,675 14,035 11,978 12,722 16,589
Construction Western Europe 4,199 7,163 7,836 9,557 9,901 10,029 10,326 10,383 11,576 12,443 14,213
Equipment 2 Eastern Europe 112 93 263 336 193 255 341 454 772 1,010 1,311
North America 1,403 3,385 5,680 6,548 5,725 5,823 6,145 5,667 5,428 8,601 10,337
South America 556 598 991 957 498 776 847 709 636 922 1,238
Asia 339 937 1,036 1,092 1,903 2,484 2,773 3,048 3,707 4,961 5,717
Other markets 307 628 847 882 662 626 703 751 1,035 1,423 2,000
Total 6,916 12,804 16,653 19,372 18,882 19,993 21,135 21,012 23,154 29,360 34,816
Volvo Penta Western Europe 2,065 2,048 2,219 2,725 2,986 3,204 3,789 3,846 4,081 4,723 4,845
Eastern Europe 1 2 34 23 26 30 38 99 108 184 257
North America 1,139 1,142 1,332 1,412 1,770 2,257 2,175 2,261 2,109 2,500 2,832
South America 99 109 136 153 134 160 213 127 146 142 208
Asia 458 486 643 476 692 794 988 1,141 947 1,324 1,427
Other markets 116 98 102 142 153 154 177 195 205 184 207
Total 3,878 3,885 4,466 4,931 5,761 6,599 7,380 7,669 7,596 9,057 9,776
Volvo Aero Western Europe 2,590 2,950 3,682 4,231 4,560 4,651 4,788 3,422 3,951 3,130 3,346
Eastern Europe 27 8 6 47 16 42 87 28 49 49 60
North America 1,100 1,071 3,066 3,502 4,557 5,040 5,841 4,573 3,301 3,127 3,612
South America 4 4 257 284 193 134 187 177 152 138 168
Asia 66 89 264 336 491 701 708 497 428 400 284
Other markets 3 21 201 184 136 145 173 140 149 81 68
Total 3,790 4,143 7,476 8,584 9,953 10,713 11,784 8,837 8,030 6,925 7,538
Other and eliminations
1 4,321 2,669 3,436 4,781 6,807 6,825 7,073 6,775 7,041 7,228 7,076
Net sales excl Financial Services 72,350 70,282 87,118 107,630 116,382 120,392 180,615 177,080 174,768 202,171 231,191
Financial Western Europe 4,758 5,384 4,461 5,465 6,300 6,240 5,314 5,573 5,604 6,114 4,213
Services Eastern Europe 0 0 86 185 257 360 424 474 499 584
North America 6 54 509 1,152 1,620 2,626 3,216 3,344 2,542 2,432 2,036
South America 153 72 297 455 452 451 403 358 396 570
Asia 0 0 0 1 0 24 49 65 90 101
Other markets 206 44 52 224 76 103 130 132 110 67 45
Total 4,970 5,635 5,094 7,224 8,637 9,678 9,495 9,925 9,153 9,598 7,549
Eliminations – – – – – – (830) (807) (630) (693) 1,819
Volvo Group excluding
divested operations 77,320 75,917 92,212 114,854 125,019 130,070 189,280 186,198 183,291 211,076 240,559
Cars 83,340 83,589 96,453 103,798 – – – – – – –
Other divested operations and eliminations 10,851 (3,446) (5,040) (5,716) – – – – – – –
Volvo Group total 171,511 156,060 183,625 212,936 125,019 130,070 189,280 186,198 183,291 211,076 240,559
Effective in 1997, the Volvo Group’s accounting per market area refl ects geo-
graphical defi nitions, based on an ISO standard. The fi gures for 1995–1996
have been adjusted to conform with the new principle.
1 Net sales 1995–2001 have been restated in accordance with new organi-
zation effective from 2002.
2 Subsidiary in the Volvo Group as of July 1995. Net sales for the Construc-
tion Equipment business area in 1995, calculated using the average
exchange rate for the US dollar in each year, amounted to 13,684.
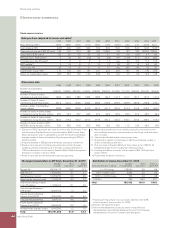
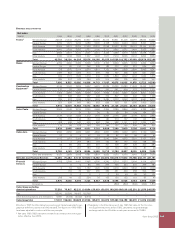
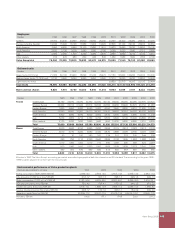
BUSINESS AREA STATISTICS