Volvo 2005 Annual Report Download - page 45
Download and view the complete annual report
Please find page 45 of the 2005 Volvo annual report below. You can navigate through the pages in the report by either clicking on the pages listed below, or by using the keyword search tool below to find specific information within the annual report.-
 1
1 -
2
-
3
-
4
-
5
-
6
-
7
-
8
-
9
-
10
-
11
-
12
-
13
-
14
-
15
-
16
-
17
-
18
-
19
-
20
-
21
-
22
-
23
-
24
-
25
-
26
-
27
-
28
-
29
-
30
-
31
-
32
-
33
-
34
-
 35
35 -
 36
36 -
 37
37 -
 38
38 -
 39
39 -
 40
40 -
 41
41 -
 42
42 -
 43
43 -
 44
44 -
 45
45 -
 46
46 -
 47
47 -
 48
48 -
 49
49 -
 50
50 -
 51
51 -
 52
52 -
 53
53 -
 54
54 -
 55
55 -
56
-
57
-
58
-
59
-
60
-
61
-
62
-
63
-
64
-
65
-
66
-
67
-
68
-
69
-
70
-
71
-
72
-
73
-
74
-
75
-
76
-
77
-
78
-
79
-
80
-
81
-
82
-
83
-
84
-
85
-
86
-
87
-
88
-
89
-
90
-
91
-
92
-
93
-
94
-
95
-
96
-
97
-
98
-
99
-
100
-
101
-
102
-
103
-
104
-
105
-
106
-
107
-
108
-
109
-
110
-
111
-
112
-
113
-
114
-
115
-
116
-
117
-
118
-
119
-
120
-
121
-
122
-
123
-
124
-
125
-
126
-
127
-
128
-
129
-
130
-
131
-
132
-
133
-
134
-
135
-
136
-
137
-
138
-
139
-
140
-
141
-
142
-
143
-
144
-
145
-
146
-
147
-
148
-
149
-
150
-
151
-
152
-
153
-
154
-
155
-
156
-
157
-
158
-
159
-
160
-
161
-
162
 |
 |

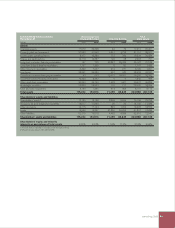
Volvo Group 2005 41
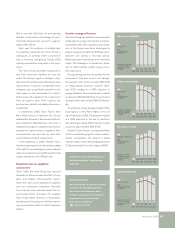
Key figures 2004 2005
Number of employees at year-end 81,078 81,856
Share of women, % 16 17
Share of women, Board members, % 15 10
Share of women, Presidents and other senior executives, % 16 16
Absence due to illness in the Group’s Swedish companies
Total absence due to illness of regular working hours, % 5.2
of which, continuous sick leave for 60 days or more, % 51.4
Absence due to illness (as percentage of regular working hours) by gender
Men, % 4.9
Women, % 6.7
Absence due to illness (as percentage of regular working hours) by age
29 years or younger, % 4.8
30–49 years, % 4.9
50 years or older, % 6.2
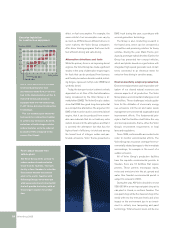
Sweden (33%)
Europe, excl.
Sweden (36%)
North America
(18%)
South America (5%)
Asia (5%)
Other (3%)
Geographic distribution
of employees, %