Volvo 2005 Annual Report Download - page 103
Download and view the complete annual report
Please find page 103 of the 2005 Volvo annual report below. You can navigate through the pages in the report by either clicking on the pages listed below, or by using the keyword search tool below to find specific information within the annual report.-
 1
1 -
2
-
3
-
4
-
5
-
6
-
7
-
8
-
9
-
10
-
11
-
12
-
13
-
14
-
15
-
16
-
17
-
18
-
19
-
20
-
21
-
22
-
23
-
24
-
25
-
26
-
27
-
28
-
29
-
30
-
31
-
32
-
33
-
34
-
35
-
36
-
37
-
38
-
39
-
40
-
41
-
42
-
43
-
44
-
45
-
46
-
47
-
48
-
49
-
50
-
51
-
52
-
53
-
54
-
55
-
56
-
57
-
58
-
59
-
60
-
61
-
62
-
63
-
64
-
65
-
66
-
67
-
68
-
69
-
70
-
71
-
72
-
73
-
74
-
75
-
76
-
77
-
78
-
79
-
80
-
81
-
82
-
83
-
84
-
85
-
86
-
87
-
88
-
89
-
90
-
91
-
92
-
 93
93 -
 94
94 -
 95
95 -
 96
96 -
 97
97 -
 98
98 -
 99
99 -
 100
100 -
 101
101 -
 102
102 -
 103
103 -
 104
104 -
 105
105 -
 106
106 -
 107
107 -
 108
108 -
 109
109 -
 110
110 -
 111
111 -
 112
112 -
 113
113 -
114
-
115
-
116
-
117
-
118
-
119
-
120
-
121
-
122
-
123
-
124
-
125
-
126
-
127
-
128
-
129
-
130
-
131
-
132
-
133
-
134
-
135
-
136
-
137
-
138
-
139
-
140
-
141
-
142
-
143
-
144
-
145
-
146
-
147
-
148
-
149
-
150
-
151
-
152
-
153
-
154
-
155
-
156
-
157
-
158
-
159
-
160
-
161
-
162
 |
 |
Volvo Group 2005 99
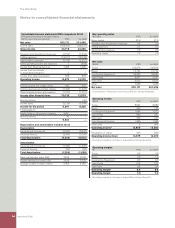
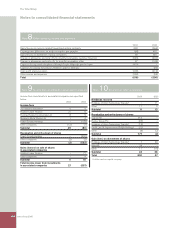
Note 5 Joint ventures
Joint ventures are companies over which Volvo has joint control
together with one or more external parties. Joint ventures are
reported by applying the proportionate consolidation method, in
accordance with IAS 31 Joint ventures. Group holdings of shares in
joint ventures are listed below.
Dec 31, 2005
Holding Holding
Shares in Joint ventures percentage no of shares
Shanghai Sunwin Bus Corp., China 50 –
Xian Silver Bus Corp., China 50 –
Volvo’s share of joint ventures’
income statements 2004 2005
Net sales 492 345
Operating income (27) (62)
Income after fi nancial items (32) (71)
Income of the period (34) (71)
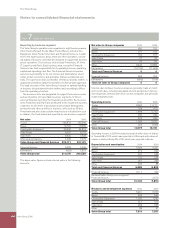
Note 6Associated companies
The following table presents summarized fi nancial information for
the associated companies partly owned by Volvo. Volvo consolidate
the associated companies according to the equity method. For more
information about Volvo’s shareholding, see notes 9 and 15.
Income statement data 2004 2005
Net sales 5,620 5,779
Cost of operations (5,449) (5,588)
Financial income and expense (9) (10)
Income before taxes 162 181
Income taxes (7) (11)
Income of the period 155 170
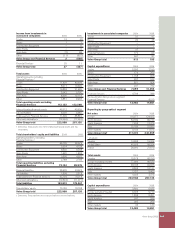
Dec 31 Dec 31
Balance sheet data 2004 2005
Property, plant and equipment, net 2,058 740
Other non-current assets 75 10
Current assets 9,408 8,979
Total Assets 11,541 9,729
Shareholders’ equity 922 608
Provisions 56 38
Long-term liabilities 1,073 160
Current liabilities 9,490 8,923
Total Shareholders’ equity
and liabilities 11,541 9,729
Volvo’s share of joint ventures’
balance sheets 2004 2005
Non-current assets 100 117
Current assets 394 386
Total assets 494 503
Shareholders’ equity 228 207
Provisions 6 1
Long-term liabilities 0 0
Current liabilities 260 295
Total shareholders’ equity
and liabilities 494 503
At the end of 2005 no guarantees were issued for the benefi t of
joint ventures, neither by Volvo alone or jointly with other venturers.
At the same date Volvo’s share of contingent liabilities issued by its
joint ventures amounted to 0 (6).
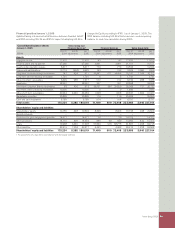
2004 2005
Average number Number of of which Number of of which
of employees employees women, % employees women, %
Shanghai Sunwin Bus Corp. 604 21 567 17
Xian Silver Bus Corp. 252 12 243 14
Total number of
employees 856 18 810 16