Volvo 2005 Annual Report Download - page 52
Download and view the complete annual report
Please find page 52 of the 2005 Volvo annual report below. You can navigate through the pages in the report by either clicking on the pages listed below, or by using the keyword search tool below to find specific information within the annual report.-
 1
1 -
2
-
3
-
4
-
5
-
6
-
7
-
8
-
9
-
10
-
11
-
12
-
13
-
14
-
15
-
16
-
17
-
18
-
19
-
20
-
21
-
22
-
23
-
24
-
25
-
26
-
27
-
28
-
29
-
30
-
31
-
32
-
33
-
34
-
35
-
36
-
37
-
38
-
39
-
40
-
41
-
 42
42 -
 43
43 -
 44
44 -
 45
45 -
 46
46 -
 47
47 -
 48
48 -
 49
49 -
 50
50 -
 51
51 -
 52
52 -
 53
53 -
 54
54 -
 55
55 -
 56
56 -
 57
57 -
 58
58 -
 59
59 -
 60
60 -
 61
61 -
 62
62 -
63
-
64
-
65
-
66
-
67
-
68
-
69
-
70
-
71
-
72
-
73
-
74
-
75
-
76
-
77
-
78
-
79
-
80
-
81
-
82
-
83
-
84
-
85
-
86
-
87
-
88
-
89
-
90
-
91
-
92
-
93
-
94
-
95
-
96
-
97
-
98
-
99
-
100
-
101
-
102
-
103
-
104
-
105
-
106
-
107
-
108
-
109
-
110
-
111
-
112
-
113
-
114
-
115
-
116
-
117
-
118
-
119
-
120
-
121
-
122
-
123
-
124
-
125
-
126
-
127
-
128
-
129
-
130
-
131
-
132
-
133
-
134
-
135
-
136
-
137
-
138
-
139
-
140
-
141
-
142
-
143
-
144
-
145
-
146
-
147
-
148
-
149
-
150
-
151
-
152
-
153
-
154
-
155
-
156
-
157
-
158
-
159
-
160
-
161
-
162
 |
 |

48 Volvo Group 2005
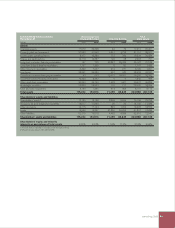
Financial performance
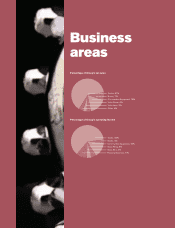
Net sales by business area
SEK M 2004 2005 %
1
Trucks 136,879 155,396 +14
Buses 12,722 16,589 +30
Construction
Equipment 29,360 34,816 +19
Volvo Penta 9,057 9,776 +8
Volvo Aero 6,925 7,538 +9
Other 7,228 7,076 (2)
Volvo Group2 202,171 231,191 +14
1 Percentage change pertains to 2005/2004.
2 Adjusted for changes in currency rates, net sales
increased by 12%.
Net sales by market area
SEK M 2004 2005 %
1
Western Europe 102,498 106,479 +4
Eastern Europe 10,556 11,401 +8
North America 52,426 67,233 +28
South America 6,949 11,901 +71
Asia 20,699 22,598 +9
Other markets 9,043 11,579 +28
Volvo Group 202,171 231,191 +14
1 Percentage change pertains to 2005/2004.
Operating income (loss) by
business area
SEK M 2004 2005
Trucks 8,992 11,717
Buses 253 470
Construction Equipment 1,898 2,752
Volvo Penta 940 943
Volvo Aero 403 836
Financial Services 1,365 2,033
Other 8 (600)
Operating income1 13,859 18,151
Revaluation of shares 820 –
Operating income 14,679 18,151
1 Excluding revaluation of shares in Scania AB and
Henlys Group Plc, 2004.
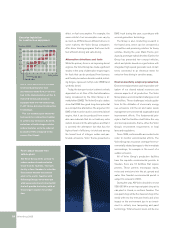
Net sales
Net sales in 2005 amounted to SEK 231,191 M
(202,171), an increase of 14% compared with
a year earlier. Adjusted for changes in cur rency
rates, net sales rose 12%.
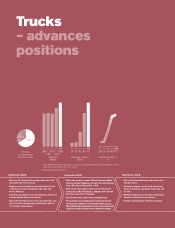
Net sales for the Group’s truck operations
amounted to SEK 155,396 M, which adjusted
for changed exchange rates corresponded to
an increase of 11%. The increase was attrib-
utable to higher sales, primarily in North
America, South America and Other markets.
Demand in North America was driven by a con-
tinued strong US economy, which resulted in
increased transport needs. In addition, there is
a need to renew truck fleets, which certain
hauling companies are doing prior to the new,
stricter emission legislation becoming
effective at the beginning of 2007. In Europe,
demand rose somewhat from an already his-
torically high level. In total, Volvo delivered
214,379 trucks in 2005, 11% more than in the
preceding year.
Net sales within Buses rose 30% compared
with 2004. Adjusted for currency effects and
purchase of the outstanding 50% of Prévost
and Nova Bus, the increase was 18%. The
increase is attributable mainly to South
America, where a large number of buses were
delivered to the new, efficient rapid transit
bus system in Santiago, Chile. As a result of a
broadened production range and improved
market shares in a rising world market, net
sales in Construction Equipment increased
by 19%. Adjusted for currency effects and
divested operations, the increase was 18%.
Volvo Penta succeeded in offsetting the
reduction in deliveries of industrial engines to
China through growing on other markets. Net
sales rose 8% in 2005, or 7% adjusted for
currency changes. The recovery in the aero-
space industry affected Volvo Aero positively
and, after several years of reduced sales, net
sales again increased. The upturn was 9% in
2005, and adjusted for changes in currency
rates, the increase was the same.
Strong economic growth combined with a
major need to replace ageing fleets of trucks
and construction equipment contributed an
increase of 28% in net sales in North America.
The rate of growth in Europe was significantly
lower for the Group, which is reflected in the
weaker economic development in Europe in
many important countries. Net sales in South
America were up 71% as a consequence of
the increased sales of mainly trucks and
buses.
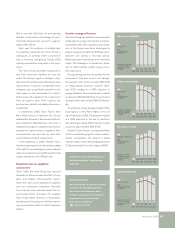
Operating income
Operating income in 2005 increased 24% to
SEK 18,151 M (14,679). Excluding a positive
effect on operating income from revaluation of
shares in Scania AB and Henlys Group of SEK
820 M in 2004, the increase was 31%. The
improvement is due mainly to increased vol-
umes, higher gross margins and a higher por-
tion of accrued development expenses.
Trucks reported operating income of SEK
11,717 M (8,992), up 30%. The increase is
attributable primarily to North America, where
Mack Trucks and Volvo Trucks increased prof-
itability through a favorable price realization
and increased volumes. In Europe, Renault
Trucks continued to improve its earnings while
profitability for Volvo Trucks’ operations in
Europe declined somewhat from a favorable
level. Operating income for the European truck
operations was impacted by increased costs
during the second half of 2005 as a conse-
q u e n c e f r o m l a u n c h e s a n d p r o d u c t i o n c h a n g e -
overs in connection to the introduction of a
new generation of trucks and engines.
Operating income in Buses continued to
improve as a result of the restructuring imple-
mented earlier and higher sales volumes, par-
ticularly in South America. Operating income
for full-year 2005 was SEK 470 M, an increase
of 86%. Through strong cost control and
increased volumes, Volvo Construction Equip-
ment continued to improve its profitability.
Operating income rose by 45% to SEK
2,752 M in 2005.