Volvo 2005 Annual Report Download - page 157
Download and view the complete annual report
Please find page 157 of the 2005 Volvo annual report below. You can navigate through the pages in the report by either clicking on the pages listed below, or by using the keyword search tool below to find specific information within the annual report.-
 1
1 -
2
-
3
-
4
-
5
-
6
-
7
-
8
-
9
-
10
-
11
-
12
-
13
-
14
-
15
-
16
-
17
-
18
-
19
-
20
-
21
-
22
-
23
-
24
-
25
-
26
-
27
-
28
-
29
-
30
-
31
-
32
-
33
-
34
-
35
-
36
-
37
-
38
-
39
-
40
-
41
-
42
-
43
-
44
-
45
-
46
-
47
-
48
-
49
-
50
-
51
-
52
-
53
-
54
-
55
-
56
-
57
-
58
-
59
-
60
-
61
-
62
-
63
-
64
-
65
-
66
-
67
-
68
-
69
-
70
-
71
-
72
-
73
-
74
-
75
-
76
-
77
-
78
-
79
-
80
-
81
-
82
-
83
-
84
-
85
-
86
-
87
-
88
-
89
-
90
-
91
-
92
-
93
-
94
-
95
-
96
-
97
-
98
-
99
-
100
-
101
-
102
-
103
-
104
-
105
-
106
-
107
-
108
-
109
-
110
-
111
-
112
-
113
-
114
-
115
-
116
-
117
-
118
-
119
-
120
-
121
-
122
-
123
-
124
-
125
-
126
-
127
-
128
-
129
-
130
-
131
-
132
-
133
-
134
-
135
-
136
-
137
-
138
-
139
-
140
-
141
-
142
-
143
-
144
-
145
-
146
-
 147
147 -
 148
148 -
 149
149 -
 150
150 -
 151
151 -
 152
152 -
 153
153 -
 154
154 -
 155
155 -
 156
156 -
 157
157 -
 158
158 -
 159
159 -
 160
160 -
 161
161 -
 162
162
 |
 |

Volvo Group 2005 153
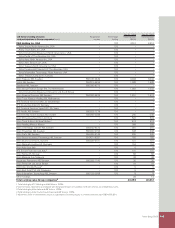
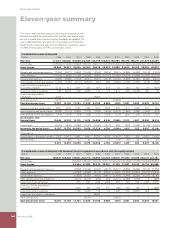
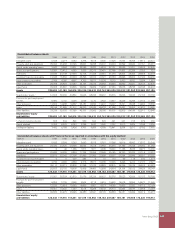
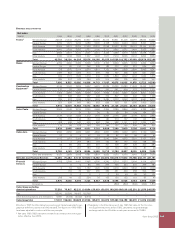
Employees
Number 1995 1996 1997 1998 1999 2000 2001 2002 2003 2004 2005
Sweden 47,000 43,330 43,650 43,900 24,840 25,030 24,350 25,420 26,380 28,530 27,070
Europe, excluding Sweden 16,930 15,290 16,100 17,880 11,900 12,320 27,800 27,130 29,120 28,930 29,650
North America 7,860 6,900 8,450 12,100 11,880 11,410 12,670 12,440 12,270 14,620 15,140
South America 3,620 2,130 2,000 1,980 1,930 2,100 2,090 2,020 2,640 3,110 3,690
Asia 2,830 2,260 1,720 3,340 2,480 2,570 2,550 2,590 3,710 4,130 4,210
Other markets 810 420 980 620 440 840 1,460 1,560 1,620 1,760 2,100
Volvo Group total 79,050 70,330 72,900 79,820 53,470 54,270 70,920 71,160 75,740 81,080 81,860
Delivered units
Number 1995 1996 1997 1998 1999 2000 2001 2002 2003 2004 2005
Heavy trucks (>16 tons) 71,360 59,100 63,930 78,690 81,240 76,470 117,180 120,200 120,920 152,300 172,242
Medium-heavy trucks (7–15.9 tons) 5,130 4,580 5,050 4,590 3,850 5,360 17,310 16,220 15,870 18,800 18,643
Light trucks (<7 tons) 20,820 20,710 19,200 22,120 23,494
Total trucks 76,490 63,680 68,980 83,280 85,090 81,830 155,310 157,130 155,990 193,220 214,379
Buses and bus chassis 6,830 7,410 8,730 10,200 9,500 11,015 9,953 9,059 7,817 8,232 10,675
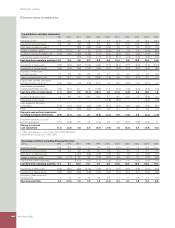
Environmental performance of Volvo production plants
Absolute values related to net sales 2001 2002 2003 2004 2005
Energy consumption (GWh; MWh/SEK M) 2,586;14.3 2,564; 14.5 2,607; 14.9 2,695; 13.3 2,683; 11.6
CO2 emissions (1,000 tons; tons/SEK M) 316; 1.7 307; 1.7 298; 1.7 293; 1.5 292; 1.3
Water consumption (1,000 m3; m3/SEK M) 9,187; 50.9 9,202; 52.0 8,587; 49.1 8,495; 42.0 7,419; 32.1
NOx emissions (tons; kilos/SEK M) 730; 4.0 726; 4.1 570; 3.3 645; 3.2 672; 2.9
Solvent emissions (tons; kilos/SEK M) 1,816; 10.1 1,896; 10.7 1,965; 11.2 2,085; 10.3 1,960; 8.5
Sulphur dioxide emissions (tons; kilos/SEK M) 308; 1.7 173; 1.0 200; 1.1 184; 0.9 209; 0.9
Hazardous waste (tons; kg/SEK M) 20,306; 112 20,531; 116 21,613; 124 24,675; 122.1 23,590; 102
Net sales, SEK bn 180.6 177.1 174.8 202.1 231.2
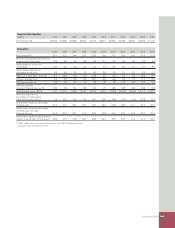
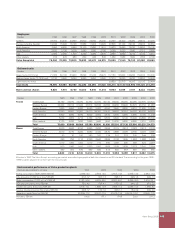
Number 1995 1996 1997 1998 1999 2000 2001 2002 2003 2004 2005
Trucks Total Europe 34,160 34,970 34,470 42,350 42,530 46,140 98,040 96,290 92,080 102,670 103,622
Western Europe 32,330 32,310 31,040 37,810 39,630 42,050 90,460 87,490 82,670 90,750 91,087
Eastern Europe 1,830 2,660 3,430 4,540 2,900 4,090 7,580 8,800 9,410 11,920 12,535
North America 27,090 16,850 20,900 29,310 34,300 23,610 34,650 36,510 34,760 49,270 64,974
South America 7,800 4,980 6,970 6,020 3,900 4,530 5,790 5,360 5,980 9,190 11,248
Asia 5,270 4,850 4,710 3,760 2,720 5,560 6,600 9,140 16,290 24,880 25,706
Other markets 2,170 2,030 1,930 1,840 1,640 1,990 10,230 9,830 6,880 7,210 8,829
Total 76,490 63,680 68,980 83,280 85,090 81,830 155,310 157,130 155,990 193,220 214,379
Buses Total Europe 3,570 3,840 4,190 3,860 3,630 3,994 3,115 3,413 3,087 3,417 3,723
Western Europe 3,510 3,770 4,030 3,580 3,430 3,870 2,899 3,076 2,782 3,073 3,385
Eastern Europe 60 70 160 280 200 124 216 337 305 344 338
North America 340 750 1,110 2,730 3,640 3,869 3,128 1,945 1,553 1,388 1,546
South America 1,510 1,460 1,350 1,510 710 980 1,009 495 369 624 2,297
Asia 920 1,060 1,410 1,650 1,000 1,659 2,209 2,639 2,227 2,341 2,554
Other markets 490 300 670 450 520 513 492 567 581 462 555
Total 6,830 7,410 8,730 10,200 9,500 11,015 9,953 9,059 7,817 8,232 10,675
Effective in 1997, The Volvo Group’s accounting per market area refl ects geographical defi nitions based on an ISO standard. The accounting for the years 1995–
1996 has been adjusted to conform with the new principle.