Volvo 2005 Annual Report Download - page 118
Download and view the complete annual report
Please find page 118 of the 2005 Volvo annual report below. You can navigate through the pages in the report by either clicking on the pages listed below, or by using the keyword search tool below to find specific information within the annual report.-
 1
1 -
2
-
3
-
4
-
5
-
6
-
7
-
8
-
9
-
10
-
11
-
12
-
13
-
14
-
15
-
16
-
17
-
18
-
19
-
20
-
21
-
22
-
23
-
24
-
25
-
26
-
27
-
28
-
29
-
30
-
31
-
32
-
33
-
34
-
35
-
36
-
37
-
38
-
39
-
40
-
41
-
42
-
43
-
44
-
45
-
46
-
47
-
48
-
49
-
50
-
51
-
52
-
53
-
54
-
55
-
56
-
57
-
58
-
59
-
60
-
61
-
62
-
63
-
64
-
65
-
66
-
67
-
68
-
69
-
70
-
71
-
72
-
73
-
74
-
75
-
76
-
77
-
78
-
79
-
80
-
81
-
82
-
83
-
84
-
85
-
86
-
87
-
88
-
89
-
90
-
91
-
92
-
93
-
94
-
95
-
96
-
97
-
98
-
99
-
100
-
101
-
102
-
103
-
104
-
105
-
106
-
107
-
 108
108 -
 109
109 -
 110
110 -
 111
111 -
 112
112 -
 113
113 -
 114
114 -
 115
115 -
 116
116 -
 117
117 -
 118
118 -
 119
119 -
 120
120 -
 121
121 -
 122
122 -
 123
123 -
 124
124 -
 125
125 -
 126
126 -
 127
127 -
 128
128 -
129
-
130
-
131
-
132
-
133
-
134
-
135
-
136
-
137
-
138
-
139
-
140
-
141
-
142
-
143
-
144
-
145
-
146
-
147
-
148
-
149
-
150
-
151
-
152
-
153
-
154
-
155
-
156
-
157
-
158
-
159
-
160
-
161
-
162
 |
 |
The Volvo Group
114 Volvo Group 2005
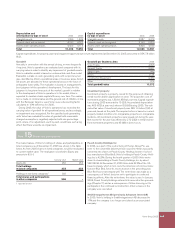
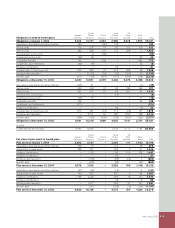
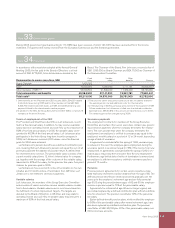
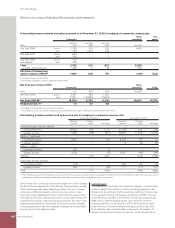
Long-term loans mature as follows:
2007 17,892
2008 13,395
2009 3,647
2010 5,192
2011 or later 3,429
Total 43,555
Of other long-term liabilities the majority will mature within fi ve years.
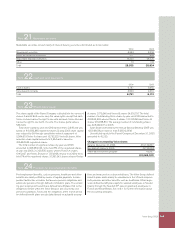
At year-end 2005, credit facilities granted but not utilized and
which can be used without restrictions amounted to approximately
SEK 21 billion (19). Approximately SEK 20 billion of these facilities
consisted of stand-by facilities for loans with varying maturities
through the year 2010. A fee normally not exceeding 0.25% of the
unused portion is charged for credit facilities.
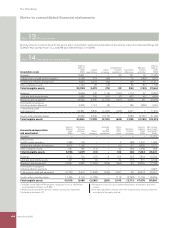
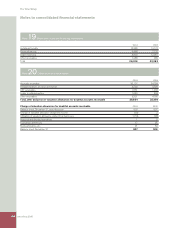
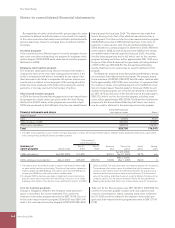
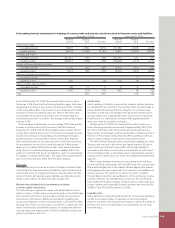
Note 27 Current liabilities
Balance sheet amounts for loans were as follows:
2004 2005
Bank loans 4,267 5,204
Other loans 17,129 26,126
Total 21,396 31,330
Bank loans include current maturities, 2,243 (2,259), of long-term
loans. Other loans include current maturities of long-term loans,
18,983 (13,324), and commercial paper, 5,413 (2,667).
Non-interest-bearing liabilities accounted for 67,681 (57,657), or
68% (73) of the Group’s total current liabilities.
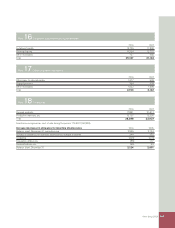
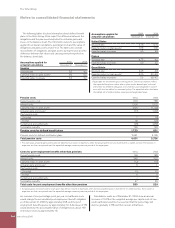
Balance sheet amounts for Other current liabilities were as follows:
2004 2005
Advances from customers 2,298 2,460
Wages, salaries and withholding taxes 4,987 5,680
VAT liabilities 1,193 1,351
Accrued expenses and prepaid income 9,736 11,850
Deferred leasing income 1,141 1,406
Residual value liability 1,873 1,840
Other liabilities 3,863 5,675
Total 25,091 30,262
Secured bank loans at year-end 2005 amounted to 186 (194). The
corresponding amount for other current liabilities was 1,685 (1,578).
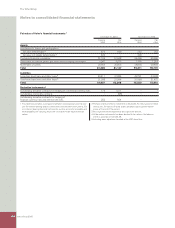
Note 28 Assets pledged
2004 2005
Property, plant and equipment – mortgages 205 593
Assets under operating leases 1,665 1,700
Chattel mortgages 374 350
Receivables 319 360
Inventories 13 16
Cash, marketable securities 470 230
Other assets pledged – 6
Total 3,046 3,255
The liabilities for which the above assets were pledged amounted at year-end to 3,372 (3,194).
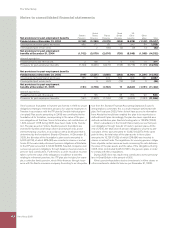
Notes to consolidated fi nancial statements