Symantec 2011 Annual Report Download - page 96
Download and view the complete annual report
Please find page 96 of the 2011 Symantec annual report below. You can navigate through the pages in the report by either clicking on the pages listed below, or by using the keyword search tool below to find specific information within the annual report.-
 1
1 -
2
-
3
-
4
-
5
-
6
-
7
-
8
-
9
-
10
-
11
-
12
-
13
-
14
-
15
-
16
-
17
-
18
-
19
-
20
-
21
-
22
-
23
-
24
-
25
-
26
-
27
-
28
-
29
-
30
-
31
-
32
-
33
-
34
-
35
-
36
-
37
-
38
-
39
-
40
-
41
-
42
-
43
-
44
-
45
-
46
-
47
-
48
-
49
-
50
-
51
-
52
-
53
-
54
-
55
-
56
-
57
-
58
-
59
-
60
-
61
-
62
-
63
-
64
-
65
-
66
-
67
-
68
-
69
-
70
-
71
-
72
-
73
-
74
-
75
-
76
-
77
-
78
-
79
-
80
-
81
-
82
-
83
-
84
-
85
-
 86
86 -
 87
87 -
 88
88 -
 89
89 -
 90
90 -
 91
91 -
 92
92 -
 93
93 -
 94
94 -
 95
95 -
 96
96 -
 97
97 -
 98
98 -
 99
99 -
 100
100 -
 101
101 -
 102
102 -
 103
103 -
 104
104 -
 105
105 -
 106
106 -
107
-
108
-
109
-
110
-
111
-
112
-
113
-
114
-
115
-
116
-
117
-
118
-
119
-
120
-
121
-
122
-
123
-
124
-
125
-
126
-
127
-
128
-
129
-
130
-
131
-
132
-
133
-
134
-
135
-
136
-
137
-
138
-
139
-
140
-
141
-
142
-
143
-
144
-
145
-
146
-
147
-
148
-
149
-
150
-
151
-
152
-
153
-
154
-
155
-
156
-
157
-
158
-
159
-
160
-
161
-
162
-
163
-
164
-
165
-
166
-
167
-
168
-
169
-
170
-
171
-
172
-
173
-
174
-
175
-
176
-
177
-
178
 |
 |
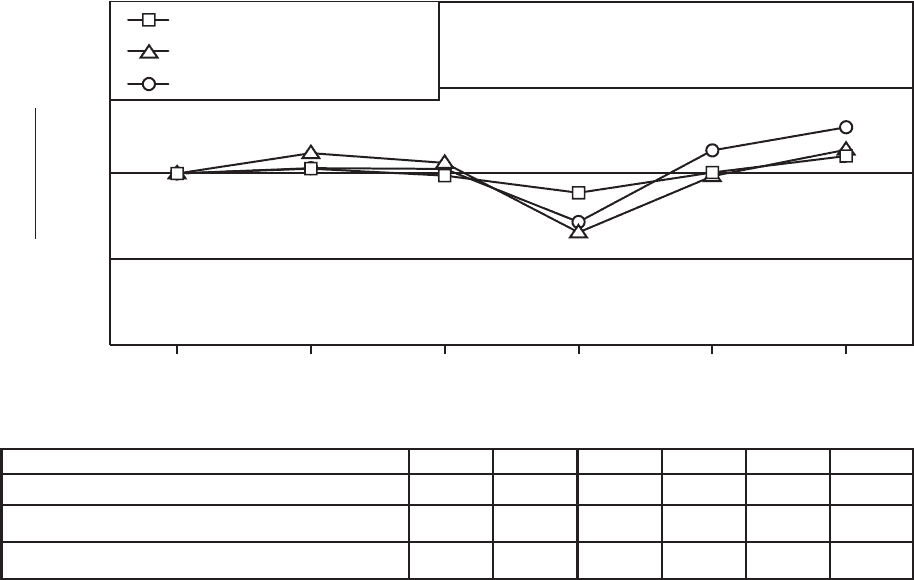
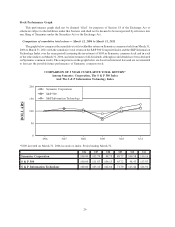
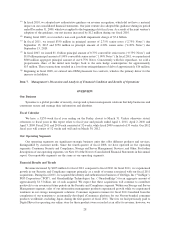
Stock Performance Graph
This performance graph shall not be deemed “filed” for purposes of Section 18 of the Exchange Act or
otherwise subject to the liabilities under that Section, and shall not be deemed to be incorporated by reference into
any filing of Symantec under the Securities Act or the Exchange Act.
Comparison of cumulative total return — March 31, 2006 to March 31, 2011
The graph below compares the cumulative total stockholder return on Symantec common stock from March 31,
2006 to March 31, 2011 with the cumulative total return on the S&P 500 Composite Index and the S&P Information
Technology Index over the same period (assuming the investment of $100 in Symantec common stock and in each
of the other indices on March 31, 2006, and reinvestment of all dividends, although no dividends have been declared
on Symantec common stock). The comparisons in the graph below are based on historical data and are not intended
to forecast the possible future performance of Symantec common stock.
COMPARISON OF 5 YEAR CUMULATIVE TOTAL RETURN*
Among Symantec Corporation, The S & P 500 Index
And The S & P Information Technology Index
3/113/103/093/083/073/06
DOLLARS
Symantec Corporation
S&P 500
S&P Information Technology
0
50
100
150
200
*$100 invested on March 31, 2006 in stock or index. Period ending March 31.
3/06 3/07 3/08 3/09 3/10 3/11
Symantec Corporation 100.00 102.79 98.75 88.77 100.58 110.16
S & P 500 100.00 111.83 106.15 65.72 98.43 113.83
S & P Information Technology 100.00 103.10 102.66 71.79 113.44 126.91
26