Symantec 2011 Annual Report Download - page 42
Download and view the complete annual report
Please find page 42 of the 2011 Symantec annual report below. You can navigate through the pages in the report by either clicking on the pages listed below, or by using the keyword search tool below to find specific information within the annual report.-
 1
1 -
2
-
3
-
4
-
5
-
6
-
7
-
8
-
9
-
10
-
11
-
12
-
13
-
14
-
15
-
16
-
17
-
18
-
19
-
20
-
21
-
22
-
23
-
24
-
25
-
26
-
27
-
28
-
29
-
30
-
31
-
 32
32 -
 33
33 -
 34
34 -
 35
35 -
 36
36 -
 37
37 -
 38
38 -
 39
39 -
 40
40 -
 41
41 -
 42
42 -
 43
43 -
 44
44 -
 45
45 -
 46
46 -
 47
47 -
 48
48 -
 49
49 -
 50
50 -
 51
51 -
 52
52 -
53
-
54
-
55
-
56
-
57
-
58
-
59
-
60
-
61
-
62
-
63
-
64
-
65
-
66
-
67
-
68
-
69
-
70
-
71
-
72
-
73
-
74
-
75
-
76
-
77
-
78
-
79
-
80
-
81
-
82
-
83
-
84
-
85
-
86
-
87
-
88
-
89
-
90
-
91
-
92
-
93
-
94
-
95
-
96
-
97
-
98
-
99
-
100
-
101
-
102
-
103
-
104
-
105
-
106
-
107
-
108
-
109
-
110
-
111
-
112
-
113
-
114
-
115
-
116
-
117
-
118
-
119
-
120
-
121
-
122
-
123
-
124
-
125
-
126
-
127
-
128
-
129
-
130
-
131
-
132
-
133
-
134
-
135
-
136
-
137
-
138
-
139
-
140
-
141
-
142
-
143
-
144
-
145
-
146
-
147
-
148
-
149
-
150
-
151
-
152
-
153
-
154
-
155
-
156
-
157
-
158
-
159
-
160
-
161
-
162
-
163
-
164
-
165
-
166
-
167
-
168
-
169
-
170
-
171
-
172
-
173
-
174
-
175
-
176
-
177
-
178
 |
 |

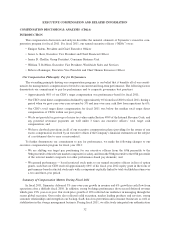
and encryption acquisitions into Symantec and grew these businesses using our broader distribution network. Our
product portfolio and customer reach have expanded as a result of these acquisitions and we believe these acquired
businesses will continue to contribute to our revenue growth and cost efficiency.
As detailed below, during fiscal 2011, three core financial metrics, which we believe are strongly correlated to
enterprise value for companies in our sector, were used to measure company performance under our executive
compensation programs: revenue, non- GAAP earnings per share (“EPS”) and cash flow from operations. In
addition, business unit performance metrics were a factor in the target bonus awards of our named executive
officers, other than our CEO, under our Executive Annual Incentive Plan. Although our revenue in fiscal 2011 was
slightly below our targeted level of performance for the full fiscal year, our EPS and cash flow from operations were
higher than our targeted levels of performance. Our named executive officers were compensated in a manner
consistent with our core pay-for-performance compensation philosophy as well as with the terms of our com-
pensation arrangements. The following are highlights of our named executive officers’ compensation for fiscal
2011 and are discussed in greater detail in this CD&A:
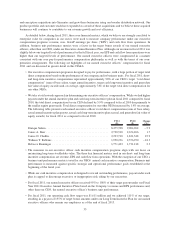
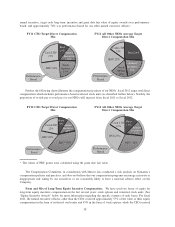
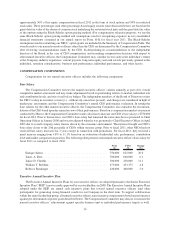
• Our executive compensation program is designed to pay for performance, with a large portion of target total
direct compensation based on the performance of our company and its business units . For fiscal 2011, short-
and long-term incentive compensation represented approximately 90% of our CEO’s target “total direct
compensation” (sum of base salary, target annual incentive, target cash long-term incentive and grant date
fair value of equity awards) and, on average, approximately 74% of the target total direct compensation for
our other NEOs.
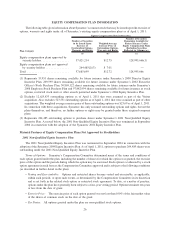
• We take a total rewards approach in determining our executive officers’ compensation. While we had higher
payouts under the annual incentive plan and cash long-term incentive plan in fiscal 2011 compared to fiscal
2010, the total direct compensation for our CEO declined by 5.9% compared to fiscal 2010 due primarily to
the smaller equity grant made. Total direct compensation for our other NEOs increased by 1.4% on average.
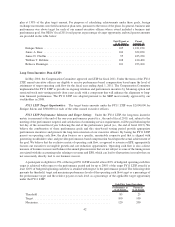
The following table presents each named executive officer’s total direct compensation (sum of base salary,
actual annual incentive plan payout, actual cash long-term incentive plan accrual, and grant date fair value of
equity awards) for fiscal 2011 as compared to fiscal 2010:
FY11
($)
FY10
($)
Change
(%)
Enrique Salem ........................................ 8,475,708 9,004,962 ⫺5.9
James A. Beer ........................................ 2,720,510 2,674,266 1.7
Janice D. Chaffin . . .................................... 2,293,710 1,821,348 25.9
William T. Robbins .................................... 1,950,236 2,576,950 ⫺24.3
Rebecca Ranninger .................................... 1,771,423 1,731,218 2.3
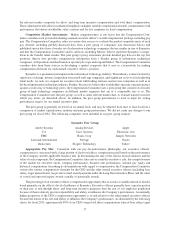
• The measures in our executive officer cash incentive compensation programs align with our focus on
maximizing long-term stockholder value. The three key financial metrics used in our short- and long-term
incentive compensation are revenue, EPS and cash flow from operations. With the exception of our CEO, a
business unit performance metric is used for our NEOs’ annual cash incentive compensation. Business unit
performance is measured against specific strategic and operational performance goals established at the
beginning of the fiscal year.
• While our cash incentive compensation is designed to reward outstanding performance, payout under each
plan is capped to discourage excessive or inappropriate risk taking by our executives.
• For fiscal 2011, our named executive officers received 95% to 108% of their target payout under our Fiscal
Year 2011 Executive Annual Incentive Plans based on the Company’s revenue and EPS performance and,
other than our CEO, the named executive officer’s business unit performance.
• For fiscal 2011, our operating cash flow target was $1,611 million and we achieved 111% of our target,
resulting in a payout of 155% of target bonus amounts under our Long Term Incentive Plan for our named
executive officers who remain our employees as of the end of fiscal 2013.
33