Symantec 2011 Annual Report Download - page 167
Download and view the complete annual report
Please find page 167 of the 2011 Symantec annual report below. You can navigate through the pages in the report by either clicking on the pages listed below, or by using the keyword search tool below to find specific information within the annual report.-
 1
1 -
2
-
3
-
4
-
5
-
6
-
7
-
8
-
9
-
10
-
11
-
12
-
13
-
14
-
15
-
16
-
17
-
18
-
19
-
20
-
21
-
22
-
23
-
24
-
25
-
26
-
27
-
28
-
29
-
30
-
31
-
32
-
33
-
34
-
35
-
36
-
37
-
38
-
39
-
40
-
41
-
42
-
43
-
44
-
45
-
46
-
47
-
48
-
49
-
50
-
51
-
52
-
53
-
54
-
55
-
56
-
57
-
58
-
59
-
60
-
61
-
62
-
63
-
64
-
65
-
66
-
67
-
68
-
69
-
70
-
71
-
72
-
73
-
74
-
75
-
76
-
77
-
78
-
79
-
80
-
81
-
82
-
83
-
84
-
85
-
86
-
87
-
88
-
89
-
90
-
91
-
92
-
93
-
94
-
95
-
96
-
97
-
98
-
99
-
100
-
101
-
102
-
103
-
104
-
105
-
106
-
107
-
108
-
109
-
110
-
111
-
112
-
113
-
114
-
115
-
116
-
117
-
118
-
119
-
120
-
121
-
122
-
123
-
124
-
125
-
126
-
127
-
128
-
129
-
130
-
131
-
132
-
133
-
134
-
135
-
136
-
137
-
138
-
139
-
140
-
141
-
142
-
143
-
144
-
145
-
146
-
147
-
148
-
149
-
150
-
151
-
152
-
153
-
154
-
155
-
156
-
 157
157 -
 158
158 -
 159
159 -
 160
160 -
 161
161 -
 162
162 -
 163
163 -
 164
164 -
 165
165 -
 166
166 -
 167
167 -
 168
168 -
 169
169 -
 170
170 -
 171
171 -
 172
172 -
 173
173 -
 174
174 -
 175
175 -
 176
176 -
 177
177 -
178
 |
 |

(2)
Refers to options cancelled before their vest dates.
(3)
Refers to options cancelled on or after their vest dates.
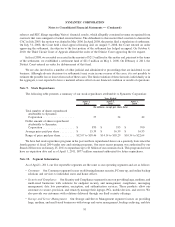
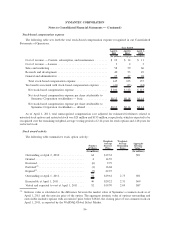
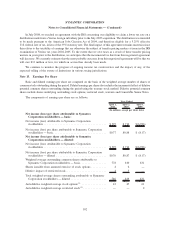
The weighted-average fair value per share of options granted during fiscal 2011, 2010, and 2009 including
assumed options was $4.04, $5.15, and $5.26, respectively. The total intrinsic value of options exercised during
fiscal 2011, 2010, and 2009 was $43 million, $64 million, and $111 million, respectively.
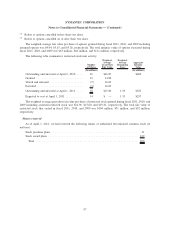
The following table summarizes restricted stock unit activity:
Number
of Shares
Weighted-
Average
Grant Date
Fair Value
Weighted-
Average
Remaining
Years
Aggregate
Intrinsic
Value
(In millions) (In millions)
Outstanding and unvested at April 2, 2010..... 16 $16.87 $260
Granted .............................. 12 14.96
Vested and released ..................... (7) 16.69
Forfeited ............................. (3) 16.05
Outstanding and unvested at April 1, 2011..... 18 $15.80 1.50 $323
Expected to vest at April 1, 2011 ........... 14 $ — 1.33 $257
The weighted-average grant date fair value per share of restricted stock granted during fiscal 2011, 2010, and
2009 including assumed restricted stock was $14.96, $15.60, and $19.41, respectively. The total fair value of
restricted stock that vested in fiscal 2011, 2010, and 2009 was $104 million, $71 million, and $52 million,
respectively.
Shares reserved
As of April 1, 2011, we had reserved the following shares of authorized but unissued common stock (in
millions):
Stock purchase plans ....................................................... 31
Stock award plans ......................................................... 169
Total ................................................................. 200
97
SYMANTEC CORPORATION
Notes to Consolidated Financial Statements — (Continued)