Symantec 2011 Annual Report Download - page 119
Download and view the complete annual report
Please find page 119 of the 2011 Symantec annual report below. You can navigate through the pages in the report by either clicking on the pages listed below, or by using the keyword search tool below to find specific information within the annual report.-
 1
1 -
2
-
3
-
4
-
5
-
6
-
7
-
8
-
9
-
10
-
11
-
12
-
13
-
14
-
15
-
16
-
17
-
18
-
19
-
20
-
21
-
22
-
23
-
24
-
25
-
26
-
27
-
28
-
29
-
30
-
31
-
32
-
33
-
34
-
35
-
36
-
37
-
38
-
39
-
40
-
41
-
42
-
43
-
44
-
45
-
46
-
47
-
48
-
49
-
50
-
51
-
52
-
53
-
54
-
55
-
56
-
57
-
58
-
59
-
60
-
61
-
62
-
63
-
64
-
65
-
66
-
67
-
68
-
69
-
70
-
71
-
72
-
73
-
74
-
75
-
76
-
77
-
78
-
79
-
80
-
81
-
82
-
83
-
84
-
85
-
86
-
87
-
88
-
89
-
90
-
91
-
92
-
93
-
94
-
95
-
96
-
97
-
98
-
99
-
100
-
101
-
102
-
103
-
104
-
105
-
106
-
107
-
108
-
 109
109 -
 110
110 -
 111
111 -
 112
112 -
 113
113 -
 114
114 -
 115
115 -
 116
116 -
 117
117 -
 118
118 -
 119
119 -
 120
120 -
 121
121 -
 122
122 -
 123
123 -
 124
124 -
 125
125 -
 126
126 -
 127
127 -
 128
128 -
 129
129 -
130
-
131
-
132
-
133
-
134
-
135
-
136
-
137
-
138
-
139
-
140
-
141
-
142
-
143
-
144
-
145
-
146
-
147
-
148
-
149
-
150
-
151
-
152
-
153
-
154
-
155
-
156
-
157
-
158
-
159
-
160
-
161
-
162
-
163
-
164
-
165
-
166
-
167
-
168
-
169
-
170
-
171
-
172
-
173
-
174
-
175
-
176
-
177
-
178
 |
 |

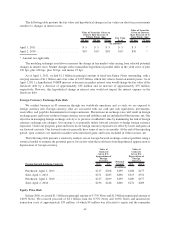
The following table presents the fair value and hypothetical changes in fair values on short-term investments
sensitive to changes in interest rates:
150 bps 100 bps 50 bps
Fair Value
As of (25 bps) (75 bps)
Value of Securities Given an
Interest Rate Increase of
X Basis Points (bps)
Value of Securities
Given an Interest
Rate Decrease of X
Basis Points (bps)
(In millions)
April 1, 2011 ........................... $ 5 $ 5 $ 5 $ 5 $ 5 *
April 2, 2010 ........................... $10 $10 $10 $10 $10 *
* Amount not applicable
The modeling technique used above measures the change in fair market value arising from selected potential
changes in interest rates. Market changes reflect immediate hypothetical parallel shifts in the yield curve of plus
150 bps, plus 100 bps, plus 50 bps, and minus 25 bps.
As of April 1, 2011, we had $1.1 billion in principal amount of fixed-rate Senior Notes outstanding, with a
carrying amount of $1.1 billion and a fair value of $1.05 billion, which fair value is based on market prices. As of
April 1, 2011, a hypothetical 50 BPS increase or decrease in market interest rates would change the fair value of the
fixed-rate debt by a decrease of approximately $34 million and an increase of approximately $35 million,
respectively. However, this hypothetical change in interest rates would not impact the interest expense on the
fixed-rate debt.
Foreign Currency Exchange Rate Risk
We conduct business in 43 currencies through our worldwide operations and, as such, we are exposed to
foreign currency risk. Foreign currency risks are associated with our cash and cash equivalents, investments,
receivables, and payables denominated in foreign currencies. Fluctuations in exchange rates will result in foreign
exchange gains and losses on these foreign currency assets and liabilities and are included in Other income, net. Our
objective in managing foreign exchange activity is to preserve stockholder value by minimizing the risk of foreign
currency exchange rate changes. Our strategy is to primarily utilize forward contracts to hedge foreign currency
exposures. Under our program, gains and losses in our foreign currency exposures are offset by losses and gains on
our forward contracts. Our forward contracts generally have terms of one to six months. At the end of the reporting
period, open contracts are marked-to-market with unrealized gains and losses included in Other income, net.
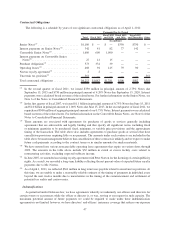
The following table presents a sensitivity analysis on our foreign forward exchange contract portfolio using a
statistical model to estimate the potential gain or loss in fair value that could arise from hypothetical appreciation or
depreciation of foreign currency:
Foreign Forward Exchange Contracts 10% 5%
Notional
Amount (5)% (10)%
Value of
Contracts
Given X%
Appreciation of
Foreign
Currency
Value of
Contracts
Given X%
Depreciation of
Foreign
Currency
(In millions)
Purchased, April 1, 2011 ........................ $217 $208 $199 $188 $177
Sold, April 1, 2011 ............................ $271 $283 $298 $313 $331
Purchased, April 2, 2010 ........................ $217 $209 $199 $189 $177
Sold, April 2, 2010 ............................ $236 $248 $260 $274 $289
Equity Price Risk
In June 2006, we issued $1.1 billion in principal amount of 0.75% Notes and $1.0 billion in principal amount of
1.00% Notes. We received proceeds of $2.1 billion from the 0.75% Notes and 1.00% Notes and incurred net
transaction costs of approximately $33 million, of which $9 million was allocated to equity and the remainder
49