Symantec 2011 Annual Report Download - page 48
Download and view the complete annual report
Please find page 48 of the 2011 Symantec annual report below. You can navigate through the pages in the report by either clicking on the pages listed below, or by using the keyword search tool below to find specific information within the annual report.-
 1
1 -
2
-
3
-
4
-
5
-
6
-
7
-
8
-
9
-
10
-
11
-
12
-
13
-
14
-
15
-
16
-
17
-
18
-
19
-
20
-
21
-
22
-
23
-
24
-
25
-
26
-
27
-
28
-
29
-
30
-
31
-
32
-
33
-
34
-
35
-
36
-
37
-
 38
38 -
 39
39 -
 40
40 -
 41
41 -
 42
42 -
 43
43 -
 44
44 -
 45
45 -
 46
46 -
 47
47 -
 48
48 -
 49
49 -
 50
50 -
 51
51 -
 52
52 -
 53
53 -
 54
54 -
 55
55 -
 56
56 -
 57
57 -
 58
58 -
59
-
60
-
61
-
62
-
63
-
64
-
65
-
66
-
67
-
68
-
69
-
70
-
71
-
72
-
73
-
74
-
75
-
76
-
77
-
78
-
79
-
80
-
81
-
82
-
83
-
84
-
85
-
86
-
87
-
88
-
89
-
90
-
91
-
92
-
93
-
94
-
95
-
96
-
97
-
98
-
99
-
100
-
101
-
102
-
103
-
104
-
105
-
106
-
107
-
108
-
109
-
110
-
111
-
112
-
113
-
114
-
115
-
116
-
117
-
118
-
119
-
120
-
121
-
122
-
123
-
124
-
125
-
126
-
127
-
128
-
129
-
130
-
131
-
132
-
133
-
134
-
135
-
136
-
137
-
138
-
139
-
140
-
141
-
142
-
143
-
144
-
145
-
146
-
147
-
148
-
149
-
150
-
151
-
152
-
153
-
154
-
155
-
156
-
157
-
158
-
159
-
160
-
161
-
162
-
163
-
164
-
165
-
166
-
167
-
168
-
169
-
170
-
171
-
172
-
173
-
174
-
175
-
176
-
177
-
178
 |
 |

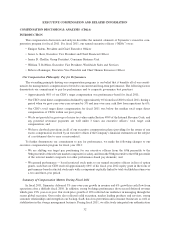
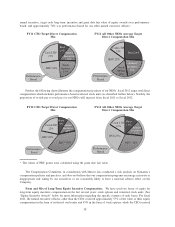
approximately 50% of his equity compensation in fiscal 2011 in the form of stock options and 50% in restricted
stock units. These percentages (and other percentage-based equity awards value discussed below) are based on the
grant date fair value of the shares of common stock underlying the restricted stock units and the grant date fair value
of the options using the Black-Scholes option pricing method. (For compensation valuation purposes, we use the
same Black-Scholes option pricing method and assumptions used for recognizing expenses in our consolidated
financial statements contained in our annual report on Form 10-K for fiscal year 2011. The Black-Scholes
assumptions used in calculating our NEOs’ option grants are included in the Summary of Compensation Table. The
awards made to our named executive officers other than the CEO are determined by the Compensation Committee
after reviewing recommendations made by the CEO. In determining its recommendations to the independent
directors of the Board, in the case of CEO compensation, and in making compensation decisions with respect to
other named executive officers, the Compensation Committee may consider factors such as the individual’s tenure
at the Company, industry experience, current pay mix, long-term equity and cash awards previously granted to the
individual, retention considerations, business unit performance, individual performance, and other factors.
COMPENSATION COMPONENTS
Compensation for our named executive officers includes the following components:
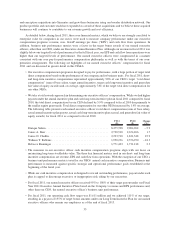
Base Salary
The Compensation Committee reviews the named executive officers’ salaries annually as part of its overall
competitive market assessment and may make adjustments based on positioning relative to market, individual role
and contribution levels, and our overall salary budget. The independent members of the Board of Directors review
the CEO’s salary in executive session (i.e., without any executives present), and changes are considered in light of
market pay assessments and the Compensation Committee’s annual CEO performance evaluation. In setting the
base salaries for the other named executive officers, the Compensation Committee also considers the recommen-
dations of the CEO based upon his annual review of their performance. Based on a compensation market assessment
conducted by Mercer, the Compensation Committee made a decision to increase our CEO’s base salary to $750,000
for fiscal 2011. Prior to this increase, our CEO’s base salary had remained the same since he was promoted to Chief
Operating Officer in January 2008 and was not adjusted when he was promoted to Chief Executive Officer in April
2009 due to overall company salary freezes driven by the economic environment. The increase brought our CEO’s
base salary closer to the 25th percentile of CEOs within our peer group. Prior to fiscal 2011, other NEOs had not
received base salary increases for 3 years except in connection with promotions. For fiscal 2011, they received a
merit increase ranging from 4.8% to 11.1% based on an evaluation of individual role, performance, contribution
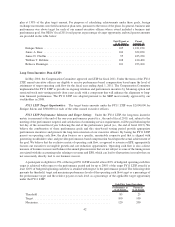
level and market compensation position. The following table presents each named executive officer’s base salary for
fiscal 2011 as compared to fiscal 2010:
FY11
($)
FY10
($)
Change
(%)
Enrique Salem ......................................... 750,000 625,000 20.0
James A. Beer ......................................... 700,000 660,000 6.1
Janice D. Chaffin ....................................... 500,000 450,000 11.1
William T. Robbins ..................................... 475,000 453,375 4.8
Rebecca Ranninger ..................................... 420,000 400,000 5.0
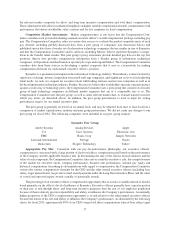
Executive Annual Incentive Plan
The Executive Annual Incentive Plans for our executive officers are adopted pursuant to the Senior Executive
Incentive Plan (“SEIP”) most recently approved by our stockholders in 2008. The Executive Annual Incentive Plans
adopted under the SEIP are annual cash incentive plans that reward named executive officers (and other
participants) for generating strong financial results for our Company in the short term. To support collaboration
within the senior leadership group, all named executive officers earn incentive compensation based on performance
against pre-determined corporate goals described below. The Compensation Committee may choose to measure the
named executive officers’ achievement against specific business unit or individual performance targets as well.
39