Symantec 2011 Annual Report Download - page 111
Download and view the complete annual report
Please find page 111 of the 2011 Symantec annual report below. You can navigate through the pages in the report by either clicking on the pages listed below, or by using the keyword search tool below to find specific information within the annual report.-
 1
1 -
2
-
3
-
4
-
5
-
6
-
7
-
8
-
9
-
10
-
11
-
12
-
13
-
14
-
15
-
16
-
17
-
18
-
19
-
20
-
21
-
22
-
23
-
24
-
25
-
26
-
27
-
28
-
29
-
30
-
31
-
32
-
33
-
34
-
35
-
36
-
37
-
38
-
39
-
40
-
41
-
42
-
43
-
44
-
45
-
46
-
47
-
48
-
49
-
50
-
51
-
52
-
53
-
54
-
55
-
56
-
57
-
58
-
59
-
60
-
61
-
62
-
63
-
64
-
65
-
66
-
67
-
68
-
69
-
70
-
71
-
72
-
73
-
74
-
75
-
76
-
77
-
78
-
79
-
80
-
81
-
82
-
83
-
84
-
85
-
86
-
87
-
88
-
89
-
90
-
91
-
92
-
93
-
94
-
95
-
96
-
97
-
98
-
99
-
100
-
 101
101 -
 102
102 -
 103
103 -
 104
104 -
 105
105 -
 106
106 -
 107
107 -
 108
108 -
 109
109 -
 110
110 -
 111
111 -
 112
112 -
 113
113 -
 114
114 -
 115
115 -
 116
116 -
 117
117 -
 118
118 -
 119
119 -
 120
120 -
 121
121 -
122
-
123
-
124
-
125
-
126
-
127
-
128
-
129
-
130
-
131
-
132
-
133
-
134
-
135
-
136
-
137
-
138
-
139
-
140
-
141
-
142
-
143
-
144
-
145
-
146
-
147
-
148
-
149
-
150
-
151
-
152
-
153
-
154
-
155
-
156
-
157
-
158
-
159
-
160
-
161
-
162
-
163
-
164
-
165
-
166
-
167
-
168
-
169
-
170
-
171
-
172
-
173
-
174
-
175
-
176
-
177
-
178
 |
 |

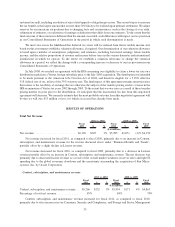
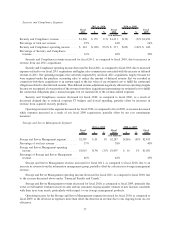
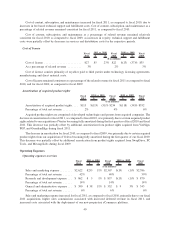
Sales and marketing expense remained relatively flat during fiscal 2010 as compared to fiscal 2009. Fiscal
2010 sales and marketing expense reflects the impact of our prior year restructuring plan, partially offset by
increases in headcount related expenses from our fiscal 2009 acquisitions and increases in Consumer OEM
placement fees and costs associated with the development and operations of our new proprietary eCommerce
platform.
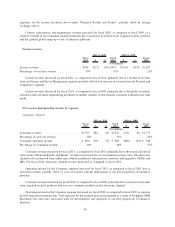
Research and development expense remained relatively flat as a percentage of revenue in fiscal 2011, 2010,
and 2009.
General and administrative expense increased for fiscal 2011, as compared to fiscal 2010, primarily due to our
fiscal 2011 acquisitions. As a percentage of revenue, general and administrative expense remained flat in fiscal
2011, 2010, and 2009.
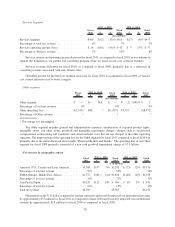
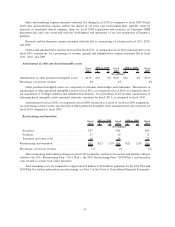
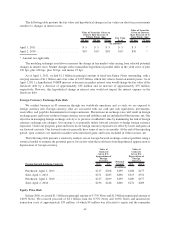
Amortization of other purchased intangible assets
Fiscal
2011 $ %
Fiscal
2010 $ %
Fiscal
2009
2011 vs. 2010 2010 vs. 2009
($ in millions)
Amortization of other purchased intangible assets . . . $270 $23 9% $247 $14 6% $233
Percentage of total net revenue ................. 4% 4% 4%
Other purchased intangible assets are comprised of customer relationships and tradenames. The increase in
amortization of other purchased intangible assets for fiscal 2011, as compared to fiscal 2010, was primarily due to
our acquisition of VeriSign’s identity and authentication business. As a percentage of net revenue, amortization of
other purchased intangible assets remained relatively consistent for fiscal 2011, as compared to fiscal 2010.
Amortization for fiscal 2010, as compared to fiscal 2009, increased as a result of our fiscal 2009 acquisitions.
As a percentage of net revenue, amortization of other purchased intangible assets remained relatively consistent for
fiscal 2010 compared to fiscal 2009.
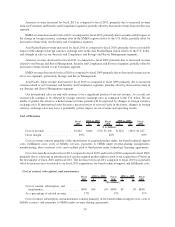
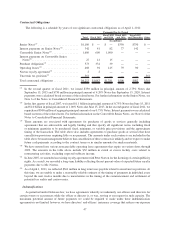
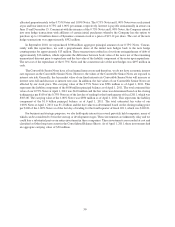
Restructuring and transition
Fiscal
2011 $ %
Fiscal
2010 $ %
Fiscal
2009
2011 vs. 2010 2010 vs. 2009
($ in millions)
Severance ................................ $47 $56 $64
Facilities ................................. 27 10 11
Transition and other costs .................... 18 28 21
Restructuring and transition ..................... $92 $(2) (2)% $94 $(2) (2)% $96
Percentage of total net revenue .................. 1% 2% 2%
The restructuring and transition charges for fiscal 2011 primarily consisted of severance and facilities charges
related to the 2011 Restructuring Plan (“2011 Plan”), the 2010 Restructuring Plan (“2010 Plan”), and transition
costs related to certain back office functions.
Total remaining costs are estimated to range from $10 million to $18 million, primarily for the 2011 Plan and
2010 Plan. For further information on restructuring, see Note 7 of the Notes to Consolidated Financial Statements.
41