Symantec 2011 Annual Report Download - page 46
Download and view the complete annual report
Please find page 46 of the 2011 Symantec annual report below. You can navigate through the pages in the report by either clicking on the pages listed below, or by using the keyword search tool below to find specific information within the annual report.-
 1
1 -
2
-
3
-
4
-
5
-
6
-
7
-
8
-
9
-
10
-
11
-
12
-
13
-
14
-
15
-
16
-
17
-
18
-
19
-
20
-
21
-
22
-
23
-
24
-
25
-
26
-
27
-
28
-
29
-
30
-
31
-
32
-
33
-
34
-
35
-
 36
36 -
 37
37 -
 38
38 -
 39
39 -
 40
40 -
 41
41 -
 42
42 -
 43
43 -
 44
44 -
 45
45 -
 46
46 -
 47
47 -
 48
48 -
 49
49 -
 50
50 -
 51
51 -
 52
52 -
 53
53 -
 54
54 -
 55
55 -
 56
56 -
57
-
58
-
59
-
60
-
61
-
62
-
63
-
64
-
65
-
66
-
67
-
68
-
69
-
70
-
71
-
72
-
73
-
74
-
75
-
76
-
77
-
78
-
79
-
80
-
81
-
82
-
83
-
84
-
85
-
86
-
87
-
88
-
89
-
90
-
91
-
92
-
93
-
94
-
95
-
96
-
97
-
98
-
99
-
100
-
101
-
102
-
103
-
104
-
105
-
106
-
107
-
108
-
109
-
110
-
111
-
112
-
113
-
114
-
115
-
116
-
117
-
118
-
119
-
120
-
121
-
122
-
123
-
124
-
125
-
126
-
127
-
128
-
129
-
130
-
131
-
132
-
133
-
134
-
135
-
136
-
137
-
138
-
139
-
140
-
141
-
142
-
143
-
144
-
145
-
146
-
147
-
148
-
149
-
150
-
151
-
152
-
153
-
154
-
155
-
156
-
157
-
158
-
159
-
160
-
161
-
162
-
163
-
164
-
165
-
166
-
167
-
168
-
169
-
170
-
171
-
172
-
173
-
174
-
175
-
176
-
177
-
178
 |
 |
the relevant market composite for short- and long-term incentive compensation and total direct compensation.
These adjustments will allow for enhanced emphasis on higher variable compensation rewards commensurate with
performance that drives stockholder value creation and for less emphasis on fixed compensation.
Competitive Market Assessments: Market competitiveness is one factor that the Compensation Com-
mittee considers each year in determining a named executive officer’s overall compensation package, including pay
mix. The Compensation Committee relies on various data sources to evaluate the market competitiveness of each
pay element, including publicly-disclosed data from a peer group of companies (see discussion below) and
published survey data from a broader set of information technology companies that are similar in size to Symantec
and that the Compensation Committee and its advisors, including Mercer, believe represent Symantec’s compe-
tition in the broader talent market. The peer group’s proxy statements provide detailed pay data for the top five
positions. Survey data provides compensation information from a broader group of information technology
companies, with positions matched based on specific job scope and responsibilities. The Compensation Committee
considers data from these sources in developing a market composite that it uses as a framework for making
compensation decisions for each named executive officer’s position.
Symantec is a prominent participant in the information technology industry. This industry is characterized by
rapid rates of change, intense competition from small and large companies, and significant cross-over in leadership
talent needs. As such, we compete for executive talent with leading software and services companies as well as in
the broad information technology industry. Further, because we believe that stockholders measure our performance
against a wide array of technology peers, the Compensation Committee uses a peer group that consists of a broader
group of high technology companies in different market segments that are of a comparable size to us. The
Compensation Committee uses the peer group, as well as other relevant market data, to evaluate named executive
officer pay levels (as described above). In addition, the peer group performance is used as input for setting
performance targets for our annual incentive plan.
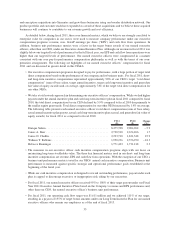
The peer group is generally reviewed on an annual basis, and may be adjusted from time to time based on a
comparison of market capitalization, industry and peer group performance. We did not make any changes to our
peer group for fiscal 2011. The following companies were included in our peer group analysis:
Symantec Peer Group
Adobe Systems Analog Devices Apple
CA Cisco Systems Electronic Arts
EMC Harris Corp Juniper Networks
Lexmark International NetApp Oracle
Qualcomm Seagate Technology Yahoo!
Appropriate Pay Mix: Consistent with our pay-for-performance philosophy, our executive officers’
compensation is structured with a large portion of their total direct compensation paid based on the performance
of the Company and the applicable business unit. In determining the mix of the various reward elements and the
value of each component, the Compensation Committee takes into account the executive’s role, the competitiveness
of the market for executive talent, company performance, business unit performance, internal pay equity and
historical compensation. In making its determinations with regard to compensation, the Compensation Committee
reviews the various compensation elements for the CEO and the other named executive officers (including base
salary, target annual bonus, target and accrued award payments under the Long Term Incentive Plans, and the value
of vested and unvested equity awards actually or potentially issued).
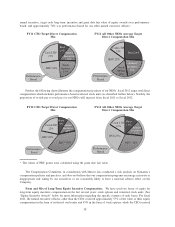
The percentage of an executive officer’s compensation opportunity that is at-risk or variable instead of fixed is
based primarily on the officer’s level of influence at Symantec. Executive officers generally have a greater portion
of their pay at risk through short- and long-term incentive programs than the rest of our employee population
because of their relatively greater responsibility and ability to influence the Company’s performance. A materially
higher proportion of the CEO’s compensation opportunity is at-risk relative to the other named executive officers
because the nature of his role and ability to influence the Company’s performance. As illustrated by the following
charts, for fiscal 2011, approximately 90% of our CEO’s target total direct compensation (sum of base salary, target
37