Symantec 2011 Annual Report Download - page 107
Download and view the complete annual report
Please find page 107 of the 2011 Symantec annual report below. You can navigate through the pages in the report by either clicking on the pages listed below, or by using the keyword search tool below to find specific information within the annual report.-
 1
1 -
2
-
3
-
4
-
5
-
6
-
7
-
8
-
9
-
10
-
11
-
12
-
13
-
14
-
15
-
16
-
17
-
18
-
19
-
20
-
21
-
22
-
23
-
24
-
25
-
26
-
27
-
28
-
29
-
30
-
31
-
32
-
33
-
34
-
35
-
36
-
37
-
38
-
39
-
40
-
41
-
42
-
43
-
44
-
45
-
46
-
47
-
48
-
49
-
50
-
51
-
52
-
53
-
54
-
55
-
56
-
57
-
58
-
59
-
60
-
61
-
62
-
63
-
64
-
65
-
66
-
67
-
68
-
69
-
70
-
71
-
72
-
73
-
74
-
75
-
76
-
77
-
78
-
79
-
80
-
81
-
82
-
83
-
84
-
85
-
86
-
87
-
88
-
89
-
90
-
91
-
92
-
93
-
94
-
95
-
96
-
 97
97 -
 98
98 -
 99
99 -
 100
100 -
 101
101 -
 102
102 -
 103
103 -
 104
104 -
 105
105 -
 106
106 -
 107
107 -
 108
108 -
 109
109 -
 110
110 -
 111
111 -
 112
112 -
 113
113 -
 114
114 -
 115
115 -
 116
116 -
 117
117 -
118
-
119
-
120
-
121
-
122
-
123
-
124
-
125
-
126
-
127
-
128
-
129
-
130
-
131
-
132
-
133
-
134
-
135
-
136
-
137
-
138
-
139
-
140
-
141
-
142
-
143
-
144
-
145
-
146
-
147
-
148
-
149
-
150
-
151
-
152
-
153
-
154
-
155
-
156
-
157
-
158
-
159
-
160
-
161
-
162
-
163
-
164
-
165
-
166
-
167
-
168
-
169
-
170
-
171
-
172
-
173
-
174
-
175
-
176
-
177
-
178
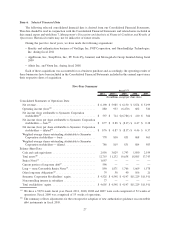
 |
 |

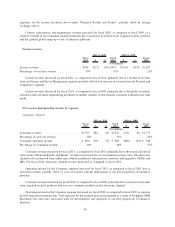
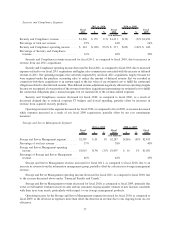
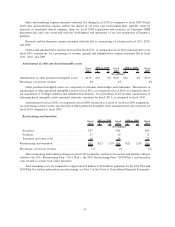
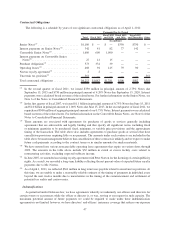
Security and Compliance Segment
Fiscal
2011 $ %
Fiscal
2010 $ %
Fiscal
2009
2011 vs. 2010 2010 vs. 2009
($ in millions)
Security and Compliance revenue . . . . . . . . . . . $1,566 $ 155 11% $1,411 $(39) (3)% $1,450
Percentage of total net revenue . . . . . . . . . . . . . 25% 24% 24%
Security and Compliance operating income . . . . $ 243 $(128) (35)% $ 371 $(69) (16)% $ 440
Percentage of Security and Compliance
revenue. . . . . . . . . . . . . . . . . . . . . . . . . . . . . 16% 26% 30%
Security and Compliance revenue increased for fiscal 2011, as compared to fiscal 2010, due to increases in
revenue from our 2011 acquisitions.
Security and Compliance operating income decreased for fiscal 2011, as compared to fiscal 2010, due to increased
expenses related to our fiscal 2011 acquisitions and higher sales commissions associated with the increase in deferred
revenue in 2011. Our operating margins were adversely impacted by our fiscal 2011 acquisitions, largely because we
were required under the purchase accounting rules to reduce the amount of deferred revenue that we recorded in
connection with these acquisitions to an amount equal to the fair value of our estimated cost to fulfill the contractual
obligations related to that deferred revenue. This deferred revenue adjustment negatively affected our operating margins
because we recognized a lower portion of the revenue from these acquisitions (representing our estimated cost to fulfill
the contractual obligations plus a normal margin), but we incurred all of the revenue-related expenses.
Security and Compliance revenue decreased for fiscal 2010, as compared to fiscal 2009, as a result of
decreased demand due to reduced corporate IT budgets and slowed spending, partially offset by increases in
revenue from acquired security products.
Operating income for the segment decreased for fiscal 2010, as compared to fiscal 2009, as revenue decreased
while expenses increased as a result of our fiscal 2009 acquisitions, partially offset by our cost containment
measures.
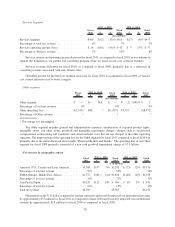
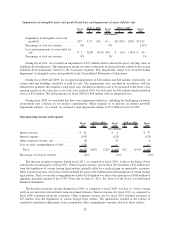
Storage and Server Management Segment
Fiscal
2011 $ %
Fiscal
2010 $ %
Fiscal
2009
2011 vs. 2010 2010 vs. 2009
($ in millions)
Storage and Server Management segment ....... $2,307 $ 20 1% $2,287 $(206) (8)% $2,493
Percentage of total net revenue . ............. 37% 38% 40%
Storage and Server Management operating
income . ............................. $1,063 $(34) (3)% $1,097 $ 16 1% $1,081
Percentage of Storage and Server Management
revenue. ............................. 46% 48% 43%
Storage and Server Management revenue increased for fiscal 2011, as compared to fiscal 2010, due to an
increase in revenue from the information management group, partially offset by a decrease in storage management
revenue.
Storage and Server Management operating income decreased for fiscal 2011, as compared to fiscal 2010, due
to the reasons discussed above under “Financial Results and Trends.”
Storage and Server Management revenue decreased for fiscal 2010, as compared to fiscal 2009, primarily due
to the overall market weakness in server sales and our customers buying smaller volumes of new licenses consistent
with their near term needs, particularly with respect to our storage management products.
Operating income for the Storage and Server Management segment increased for fiscal 2010, as compared to
fiscal 2009, as the decrease in expenses more than offset the decrease in revenue due to our ongoing focus on cost
efficiency.
37