Symantec 2011 Annual Report Download - page 6
Download and view the complete annual report
Please find page 6 of the 2011 Symantec annual report below. You can navigate through the pages in the report by either clicking on the pages listed below, or by using the keyword search tool below to find specific information within the annual report.-
 1
1 -
 2
2 -
 3
3 -
 4
4 -
 5
5 -
 6
6 -
 7
7 -
 8
8 -
 9
9 -
 10
10 -
 11
11 -
 12
12 -
 13
13 -
 14
14 -
 15
15 -
 16
16 -
 17
17 -
18
-
19
-
20
-
21
-
22
-
23
-
24
-
25
-
26
-
27
-
28
-
29
-
30
-
31
-
32
-
33
-
34
-
35
-
36
-
37
-
38
-
39
-
40
-
41
-
42
-
43
-
44
-
45
-
46
-
47
-
48
-
49
-
50
-
51
-
52
-
53
-
54
-
55
-
56
-
57
-
58
-
59
-
60
-
61
-
62
-
63
-
64
-
65
-
66
-
67
-
68
-
69
-
70
-
71
-
72
-
73
-
74
-
75
-
76
-
77
-
78
-
79
-
80
-
81
-
82
-
83
-
84
-
85
-
86
-
87
-
88
-
89
-
90
-
91
-
92
-
93
-
94
-
95
-
96
-
97
-
98
-
99
-
100
-
101
-
102
-
103
-
104
-
105
-
106
-
107
-
108
-
109
-
110
-
111
-
112
-
113
-
114
-
115
-
116
-
117
-
118
-
119
-
120
-
121
-
122
-
123
-
124
-
125
-
126
-
127
-
128
-
129
-
130
-
131
-
132
-
133
-
134
-
135
-
136
-
137
-
138
-
139
-
140
-
141
-
142
-
143
-
144
-
145
-
146
-
147
-
148
-
149
-
150
-
151
-
152
-
153
-
154
-
155
-
156
-
157
-
158
-
159
-
160
-
161
-
162
-
163
-
164
-
165
-
166
-
167
-
168
-
169
-
170
-
171
-
172
-
173
-
174
-
175
-
176
-
177
-
178
 |
 |

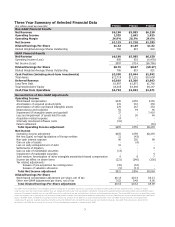
Three Year Summary of Selected Financial Data
($ in millions, except per share data)
FY2011 FY2010 FY2009
Non-GAAP Financial Results
Net Revenue $6,190 $5,985 $6,150
Operating Income 1,535 1,692 1,823
Operating Margin
24.8% 28.3% 29.6%
Net Income $1,119 $1,220 $1,283
Diluted Earnings Per Share $1.42 $1.49 $1.52
Diluted Weighted-Average Shares Outstanding 786 819 842
GAAP Financial Results
Net Revenue $6,190 $5,985 $6,150
Operating Income (Loss) 880 933 (6,470)
Net Income (Loss) $597 $714 ($6,786)
Diluted Earnings Per Share $0.76 $0.87 ($8.17)
Diluted Weighted-Average Shares Outstanding 786 819 831
Cash Position (including short-term investments) $2,958 $3,044 $1,992
Total Assets $12,719 $11,232 $10,638
Deferred Revenue $3,819 $3,206 $3,063
Long-Term Debt $1,987 $1,871 $1,766
Total Stockholders’ Equity $4,605 $4,548 $4,147
Cash Flow from Operations $1,794 $1,693 $1,671
Reconciliation of Non-GAAP Adjustments
Operating Income
Stock-based compensation $145 $155 $156
Amortization of acquired product rights 115 233 353
Amortization of other purchased intangible assets 270 247 233
Restructuring and transition 92 94 96
Impairment of intangible assets and goodwill 27 - 7,419
Loss and impairment of assets held for sale 2 30 46
Acquisition-related expense 14 - -
Internally developed software costs (10) - -
Patent settlement - - (10)
Total Operating Income adjustment $655 $759 $8,293
Net Income
Operating Income adjustment $655 $759 $8,293
Net loss (gain) on legal liquidations of foreign entities 21 (43) -
Non-cash interest expense 96 105 98
Gain on sale of assets - (4) -
Loss on early extinguishment of debt 16 - -
Settlements of litigation - - 3
Gain on sale of marketable securities (13) - -
Impairment of marketable securities - - 4
Joint venture: Amortization of other intangible assets/stock-based compensation 9 8 7
Income tax effect on above items (221) (246) (336)
Tax related adjustments:
Release of pre-acquisition tax contingencies (32) (62) -
Release of valuation allowance (9) (11) -
Total Net Income adjustment $522 $506 $8,069
Diluted Earnings Per Share
Stock-based compensation adjustment per share, net of tax $0.14 $0.14 $0.13
Other non-GAAP adjustments per share, net of tax 0.52 0.48 9.56
Total Diluted Earnings Per Share adjustment $0.66 $0.62 $9.69
Our GAAP results of operations have undergone significant change due to a goodwill impairment, acquisitions, the impact of SFAS 123(R) and other corporate events. To help our readers
understand our past and future financial performance, we supplement the financials that we provide in accordance with generally accepted accounting principles (GAAP) with non-GAAP financial
measures. Management regularly uses our non-GAAP measures to understand, manage and evaluate our business and make operating decisions. These non-GAAP measures are among the primary
factors management uses in planning for and forecasting future periods. Investors are encouraged to review the reconciliation of our non-GAAP financial measures to the comparable GAAP results,
which is provided above, attached to our quarterly earnings release and available on our Web site at www.symantec.com/invest. These non-GAAP financial measures are not prepared in
accordance with generally accepted accounting principles and may be different from non-GAAP financial measures used by other companies. Non-GAAP financial measures should not be
considered a substitute for, or superior to, measures of financial performance prepared in accordance with GAAP.
5