Symantec 2011 Annual Report Download - page 110
Download and view the complete annual report
Please find page 110 of the 2011 Symantec annual report below. You can navigate through the pages in the report by either clicking on the pages listed below, or by using the keyword search tool below to find specific information within the annual report.-
 1
1 -
2
-
3
-
4
-
5
-
6
-
7
-
8
-
9
-
10
-
11
-
12
-
13
-
14
-
15
-
16
-
17
-
18
-
19
-
20
-
21
-
22
-
23
-
24
-
25
-
26
-
27
-
28
-
29
-
30
-
31
-
32
-
33
-
34
-
35
-
36
-
37
-
38
-
39
-
40
-
41
-
42
-
43
-
44
-
45
-
46
-
47
-
48
-
49
-
50
-
51
-
52
-
53
-
54
-
55
-
56
-
57
-
58
-
59
-
60
-
61
-
62
-
63
-
64
-
65
-
66
-
67
-
68
-
69
-
70
-
71
-
72
-
73
-
74
-
75
-
76
-
77
-
78
-
79
-
80
-
81
-
82
-
83
-
84
-
85
-
86
-
87
-
88
-
89
-
90
-
91
-
92
-
93
-
94
-
95
-
96
-
97
-
98
-
99
-
 100
100 -
 101
101 -
 102
102 -
 103
103 -
 104
104 -
 105
105 -
 106
106 -
 107
107 -
 108
108 -
 109
109 -
 110
110 -
 111
111 -
 112
112 -
 113
113 -
 114
114 -
 115
115 -
 116
116 -
 117
117 -
 118
118 -
 119
119 -
 120
120 -
121
-
122
-
123
-
124
-
125
-
126
-
127
-
128
-
129
-
130
-
131
-
132
-
133
-
134
-
135
-
136
-
137
-
138
-
139
-
140
-
141
-
142
-
143
-
144
-
145
-
146
-
147
-
148
-
149
-
150
-
151
-
152
-
153
-
154
-
155
-
156
-
157
-
158
-
159
-
160
-
161
-
162
-
163
-
164
-
165
-
166
-
167
-
168
-
169
-
170
-
171
-
172
-
173
-
174
-
175
-
176
-
177
-
178
 |
 |

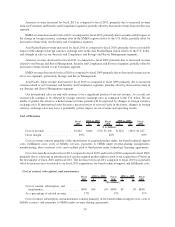
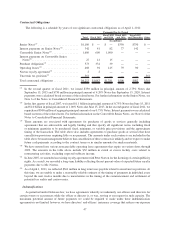
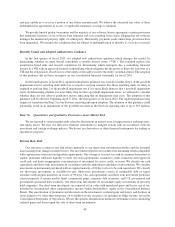
Cost of content, subscription, and maintenance increased for fiscal 2011, as compared to fiscal 2010, due to
increases in fee-based technical support and fulfillment costs. Cost of content, subscription, and maintenance as a
percentage of related revenue remained consistent for fiscal 2011, as compared to fiscal 2010.
Cost of content, subscription, and maintenance as a percentage of related revenue remained relatively
consistent for fiscal 2010, as compared to fiscal 2009, as increases in royalty, technical support and fulfillment
costs were partially offset by decreases in services and distribution costs for the respective periods.
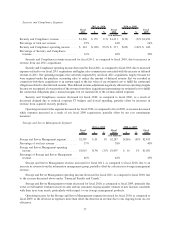
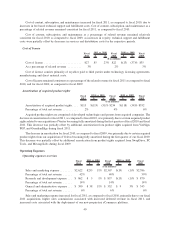
Cost of license
Fiscal
2011 $ %
Fiscal
2010 $ %
Fiscal
2009
2011 vs. 2010 2010 vs. 2009
($ in millions)
Cost of license ........................ $27 $5 23% $22 $(13) (37)% $35
As a percentage of related revenue ......... 3% 2% 3%
Cost of license consists primarily of royalties paid to third parties under technology licensing agreements,
manufacturing and direct material costs.
Cost of license remained consistent as a percentage of the related revenue for fiscal 2011 as compared to fiscal
2010, and for fiscal 2010, as compared to fiscal 2009.
Amortization of acquired product rights
Fiscal
2011 $ %
Fiscal
2010 $ %
Fiscal
2009
2011 vs. 2010 2010 vs. 2009
($ in millions)
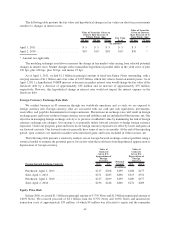
Amortization of acquired product rights.... $115 $(119) (51)% $234 $(118) (34)% $352
Percentage of total net revenue .......... 2% 4% 6%
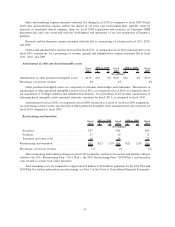
Acquired product rights are comprised of developed technologies and patents from acquired companies. The
decrease in amortization for fiscal 2011, as compared to fiscal 2010, was primarily due to certain acquired product
rights related to our acquisition of Veritas becoming fully amortized during the first quarters of fiscal 2010 and fiscal
2011. This decrease was partially offset by additional amortization from product rights acquired from VeriSign,
PGP, and GuardianEdge during fiscal 2011.
The decrease in amortization for fiscal 2010, as compared to fiscal 2009, was primarily due to certain acquired
product rights from our acquisition of Veritas becoming fully amortized during the first quarter of our fiscal 2010.
This decrease was partially offset by additional amortization from product rights acquired from SwapDrive, PC
Tools, and MessageLabs during fiscal 2009.
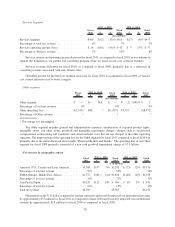
Operating Expenses
Operating expenses overview
Fiscal
2011 $ %
Fiscal
2010 $ %
Fiscal
2009
2011 vs. 2010 2010 vs. 2009
($ in millions)
Sales and marketing expense ........ $2,622 $255 11% $2,367 $(19) (1)% $2,386
Percentage of total net revenue ...... 42% 40% 39%
Research and development expense . . . $ 862 $ 5 1% $ 857 $(13) (1)% $ 870
Percentage of total net revenue ...... 14% 14% 14%
General and administrative expense . . . $ 390 $ 38 11% $ 352 $ 9 3% $ 343
Percentage of total net revenue ...... 6% 6% 6%
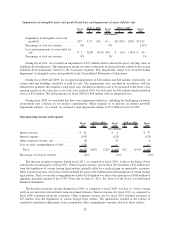
Sales and marketing expense increased for fiscal 2011, as compared to fiscal 2010, primarily due to our fiscal
2011 acquisitions, higher sales commissions associated with increased deferred revenue in fiscal 2011, and
increased costs associated with the deployment of our new proprietary eCommerce platform.
40