Symantec 2011 Annual Report Download - page 112
Download and view the complete annual report
Please find page 112 of the 2011 Symantec annual report below. You can navigate through the pages in the report by either clicking on the pages listed below, or by using the keyword search tool below to find specific information within the annual report.-
 1
1 -
2
-
3
-
4
-
5
-
6
-
7
-
8
-
9
-
10
-
11
-
12
-
13
-
14
-
15
-
16
-
17
-
18
-
19
-
20
-
21
-
22
-
23
-
24
-
25
-
26
-
27
-
28
-
29
-
30
-
31
-
32
-
33
-
34
-
35
-
36
-
37
-
38
-
39
-
40
-
41
-
42
-
43
-
44
-
45
-
46
-
47
-
48
-
49
-
50
-
51
-
52
-
53
-
54
-
55
-
56
-
57
-
58
-
59
-
60
-
61
-
62
-
63
-
64
-
65
-
66
-
67
-
68
-
69
-
70
-
71
-
72
-
73
-
74
-
75
-
76
-
77
-
78
-
79
-
80
-
81
-
82
-
83
-
84
-
85
-
86
-
87
-
88
-
89
-
90
-
91
-
92
-
93
-
94
-
95
-
96
-
97
-
98
-
99
-
100
-
101
-
 102
102 -
 103
103 -
 104
104 -
 105
105 -
 106
106 -
 107
107 -
 108
108 -
 109
109 -
 110
110 -
 111
111 -
 112
112 -
 113
113 -
 114
114 -
 115
115 -
 116
116 -
 117
117 -
 118
118 -
 119
119 -
 120
120 -
 121
121 -
 122
122 -
123
-
124
-
125
-
126
-
127
-
128
-
129
-
130
-
131
-
132
-
133
-
134
-
135
-
136
-
137
-
138
-
139
-
140
-
141
-
142
-
143
-
144
-
145
-
146
-
147
-
148
-
149
-
150
-
151
-
152
-
153
-
154
-
155
-
156
-
157
-
158
-
159
-
160
-
161
-
162
-
163
-
164
-
165
-
166
-
167
-
168
-
169
-
170
-
171
-
172
-
173
-
174
-
175
-
176
-
177
-
178
 |
 |

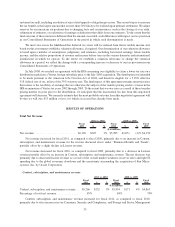
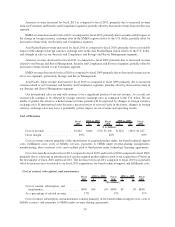
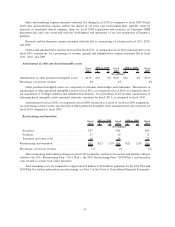
Impairment of intangible assets and goodwill and Loss and impairment of assets held for sale
Fiscal
2011 $ %
Fiscal
2010 $ %
Fiscal
2009
2011 vs. 2010 2010 vs. 2009
($ in millions)
Impairment of intangible assets and
goodwill....................... $27 $27 NA $— $(7,419) 100% $7,419
Percentage of total net revenue . ....... 0% 0% 121%
Loss and impairment of assets held for
sale .......................... $ 2 $(28) (93)% $30 $ (16) (35)% $ 46
Percentage of total net revenue . ....... 0% 1% 1%
During fiscal 2011, we recorded an impairment of $27 million which reduced the gross carrying value of
indefinite-lived tradenames. This impairment charge was due to reductions in expected future cash flows for certain
indefinite-lived tradenames related to the Consumer segment. This impairment charge was recorded within
Impairment of intangible assets and goodwill on the Consolidated Statements of Operations.
During fiscal 2010 and 2009, we recognized impairments of $20 million and $46 million, respectively, on
certain land and buildings classified as held for sale. The impairments were recorded in accordance with the
authoritative guidance that requires a long-lived asset classified as held for sale to be measured at the lower of its
carrying amount or fair value, less cost to sell. Also, in fiscal 2010, we sold assets for $42 million which resulted in
losses of $10 million. We sold properties in fiscal 2009 for $40 million with an immaterial loss.
During fiscal 2009, we concluded that there were impairment indicators, including the challenging economic
environment and a decline in our market capitalization, which required us to perform an interim goodwill
impairment analysis. As a result, we incurred a total impairment charge of $7.4 billion for fiscal 2009.
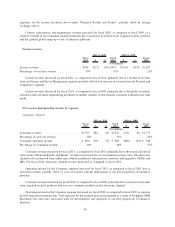
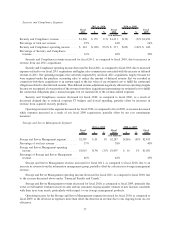
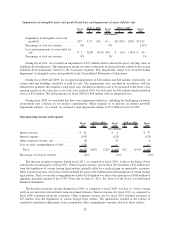
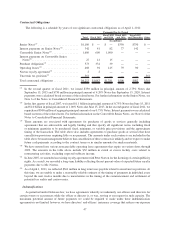
Non-operating income and expense
Fiscal
2011 $ %
Fiscal
2010 $ %
Fiscal
2009
2011 vs. 2010 2010 vs. 2009
($ in millions)
Interest income . . . ...................... $ 10 $ 6 $ 37
Interest expense . . ...................... (143) (129) (125)
Other (expense) income, net ............... (2) 55 8
Loss on early extinguishment of debt ........ (16) — —
Total ............................... $(151) $(83) 122% $ (68) $12 (15)% $ (80)
Percentage of total net revenue ............. (2)% (1)% (1)%
The increase in interest expense during fiscal 2011, as compared to fiscal 2010, is due to the Senior Notes
issued in the second quarter of fiscal 2011. Other (expense) income, net for fiscal 2011 includes a $21 million loss
from the liquidation of certain foreign legal entities, partially offset by a realized gain on marketable securities.
Other (expense) income, net for fiscal 2010 included net gains of $47 million from the liquidation of certain foreign
legal entities. The Loss on early extinguishment of debt of $16 million was due to the repurchase of $500 million of
aggregate principal amount of the 0.75% Notes due on June 15, 2011. See Note 6 of the Notes to Consolidated
Financial Statements.
The decrease in interest income during fiscal 2010, as compared to fiscal 2009, was due to a lower average
yield on our invested cash and short-term investment balances. Interest expense for fiscal 2010, as compared to
fiscal 2009, remained relatively consistent. Other (expense) income, net for fiscal 2010 included net gains of
$47 million from the liquidation of certain foreign legal entities. The liquidations resulted in the release of
cumulative translation adjustments from accumulated other comprehensive income related to these entities.
42