Symantec 2011 Annual Report Download - page 59
Download and view the complete annual report
Please find page 59 of the 2011 Symantec annual report below. You can navigate through the pages in the report by either clicking on the pages listed below, or by using the keyword search tool below to find specific information within the annual report.-
 1
1 -
2
-
3
-
4
-
5
-
6
-
7
-
8
-
9
-
10
-
11
-
12
-
13
-
14
-
15
-
16
-
17
-
18
-
19
-
20
-
21
-
22
-
23
-
24
-
25
-
26
-
27
-
28
-
29
-
30
-
31
-
32
-
33
-
34
-
35
-
36
-
37
-
38
-
39
-
40
-
41
-
42
-
43
-
44
-
45
-
46
-
47
-
48
-
 49
49 -
 50
50 -
 51
51 -
 52
52 -
 53
53 -
 54
54 -
 55
55 -
 56
56 -
 57
57 -
 58
58 -
 59
59 -
 60
60 -
 61
61 -
 62
62 -
 63
63 -
 64
64 -
 65
65 -
 66
66 -
 67
67 -
 68
68 -
 69
69 -
70
-
71
-
72
-
73
-
74
-
75
-
76
-
77
-
78
-
79
-
80
-
81
-
82
-
83
-
84
-
85
-
86
-
87
-
88
-
89
-
90
-
91
-
92
-
93
-
94
-
95
-
96
-
97
-
98
-
99
-
100
-
101
-
102
-
103
-
104
-
105
-
106
-
107
-
108
-
109
-
110
-
111
-
112
-
113
-
114
-
115
-
116
-
117
-
118
-
119
-
120
-
121
-
122
-
123
-
124
-
125
-
126
-
127
-
128
-
129
-
130
-
131
-
132
-
133
-
134
-
135
-
136
-
137
-
138
-
139
-
140
-
141
-
142
-
143
-
144
-
145
-
146
-
147
-
148
-
149
-
150
-
151
-
152
-
153
-
154
-
155
-
156
-
157
-
158
-
159
-
160
-
161
-
162
-
163
-
164
-
165
-
166
-
167
-
168
-
169
-
170
-
171
-
172
-
173
-
174
-
175
-
176
-
177
-
178
 |
 |

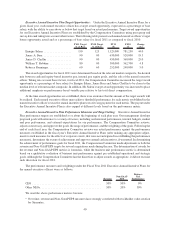
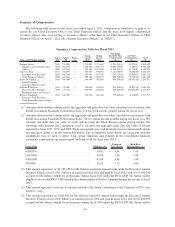
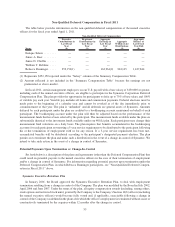
Summary of Compensation
The following table shows for the fiscal year ended April 1, 2011, compensation awarded to or paid to, or
earned by, our Chief Executive Officer, our Chief Financial Officer and the three most highly compensated
executive officers who were serving as executive officers (other than as our Chief Executive Officer or Chief
Financial Officer) at April 1, 2011 (the “Named Executive Officers” or “NEOs”).
Summary Compensation Table for Fiscal 2011
Name and Principal Position
Fiscal
Year
Salary
($)
Bonus
($)
Stock
Awards
($)(1)
Option
Awards
($)(2)
Non-Equity
Incentive Plan
Compensation
($)
All Other
Compensation
($)
Total
($)
Enrique Salem ............. 2011 750,000 — 1,732,800 1,711,658 4,281,250(3) 33,975(4) 8,509,683
President and Chief Executive 2010 625,000 — 2,398,200 2,888,793 3,092,969(5) 17,387(6) 9,022,349
Officer 2009 625,000 — 999,500 1,267,848 1,246,875(7) 15,756(8) 4,154,979
JamesA.Beer.............. 2011 700,000 — 505,400 398,060 1,117,050(9) 19,632(10) 2,740,142
Executive Vice President, 2010 660,000 — 720,040 547,106 747,120(11) 12,949(12) 2,687,215
Chief Financial Officer 2009 660,000 — 599,700 528,270 884,700(13) 8,998(14) 2,681,668
Janice D. Chaffin. . . ......... 2011 500,000 — 505,400 398,060 890,250(15) 60,631(16) 2,354,341
Group President,
Consumer Business Unit
William T. Robbins . ......... 2011 475,000 — 361,000 238,836 875,400(17) 35,427(18) 1,985,663
Executive Vice President, 2010 453,375 — 812,930 684,845 625,800(19) 194,627(20) 2,771,577
Worldwide Sales and Services
Rebecca Ranninger . ......... 2011 420,000 — 346,560 286,603 718,260(21) 6,150(22) 1,777,573
Executive Vice President,
Chief Human Resources Officer
(1) Amounts shown in this column reflect the aggregate full grant date fair value calculated in accordance with
FASB Accounting Standards Codification Topic 718 for stock awards granted during the fiscal year.
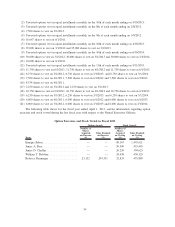
(2) Amounts shown in this column reflect the aggregate full grant date fair value calculated in accordance with
FASB Accounting Standards Codification Topic 718 for option awards granted during the fiscal year. We
calculate the grant date fair value of stock options using the Black-Scholes option pricing model. The
following table includes the assumptions used to calculate the aggregate grant date fair value of awards
reported for fiscal 2011, 2010, and 2009. We do not currently pay cash dividends on our common stock and do
not anticipate doing so in the foreseeable future. The assumptions listed below are consistent with the
assumptions that we used to report stock option valuations and expense in the consolidated financial
statements contained in our annual report on Form 10-K for fiscal year 2011:
Grant Date Volatility (%)
Expected
Life (Years)
Risk-Free
Interest Rate (%)
6/10/2010 .................................. 34.02 3.51 1.93
5/11/2009 .................................. 43.94 3.38 1.46
4/10/2009 .................................. 43.94 3.38 1.46
5/9/2008 ................................... 34.53 3.12 2.06
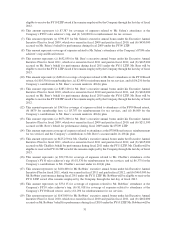
(3) This amount represents (a) $1,181,250 for Mr. Salem’s executive annual bonus under his Executive Annual
Incentive Plan for fiscal 2011, which was earned in fiscal 2011 and paid in fiscal 2012, and (b) $3,100,000
accrued on Mr. Salem’s behalf for performance during fiscal 2011 under the FY11 LTIP. Mr. Salem will be
eligible to receive the FY11 LTIP award if he remains employed by the Company through the last day of fiscal
2013.
(4) This amount represents coverage of expenses related to Mr. Salem’s attendance at the Company’s FY10 sales
achiever’s trip.
(5) This amount represents (a) $292,969 for Mr. Salem’s executive annual bonus under his Executive Annual
Incentive Plan for fiscal 2010, which was earned in fiscal 2010 and paid in fiscal 2011, and (b) $2,800,000
accrued on Mr. Salem’s behalf for performance during fiscal 2010 under the FY10 LTIP. Mr. Salem will be
50