Symantec 2011 Annual Report Download - page 47
Download and view the complete annual report
Please find page 47 of the 2011 Symantec annual report below. You can navigate through the pages in the report by either clicking on the pages listed below, or by using the keyword search tool below to find specific information within the annual report.-
 1
1 -
2
-
3
-
4
-
5
-
6
-
7
-
8
-
9
-
10
-
11
-
12
-
13
-
14
-
15
-
16
-
17
-
18
-
19
-
20
-
21
-
22
-
23
-
24
-
25
-
26
-
27
-
28
-
29
-
30
-
31
-
32
-
33
-
34
-
35
-
36
-
 37
37 -
 38
38 -
 39
39 -
 40
40 -
 41
41 -
 42
42 -
 43
43 -
 44
44 -
 45
45 -
 46
46 -
 47
47 -
 48
48 -
 49
49 -
 50
50 -
 51
51 -
 52
52 -
 53
53 -
 54
54 -
 55
55 -
 56
56 -
 57
57 -
58
-
59
-
60
-
61
-
62
-
63
-
64
-
65
-
66
-
67
-
68
-
69
-
70
-
71
-
72
-
73
-
74
-
75
-
76
-
77
-
78
-
79
-
80
-
81
-
82
-
83
-
84
-
85
-
86
-
87
-
88
-
89
-
90
-
91
-
92
-
93
-
94
-
95
-
96
-
97
-
98
-
99
-
100
-
101
-
102
-
103
-
104
-
105
-
106
-
107
-
108
-
109
-
110
-
111
-
112
-
113
-
114
-
115
-
116
-
117
-
118
-
119
-
120
-
121
-
122
-
123
-
124
-
125
-
126
-
127
-
128
-
129
-
130
-
131
-
132
-
133
-
134
-
135
-
136
-
137
-
138
-
139
-
140
-
141
-
142
-
143
-
144
-
145
-
146
-
147
-
148
-
149
-
150
-
151
-
152
-
153
-
154
-
155
-
156
-
157
-
158
-
159
-
160
-
161
-
162
-
163
-
164
-
165
-
166
-
167
-
168
-
169
-
170
-
171
-
172
-
173
-
174
-
175
-
176
-
177
-
178
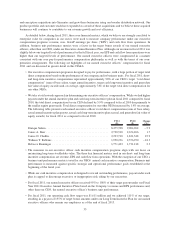
 |
 |

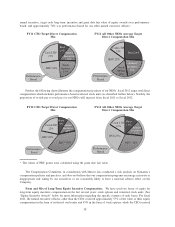
annual incentive, target cash long-term- incentive and grant date fair value of equity awards) was performance-
based, and approximately 74% was performance-based for our other named executive officers:
FY11 CEO Target Direct Compensation
Mix
FY11 All Other NEOs Average Target
Direct Compensation Mix
Annual
Incentive
15%
Stock
Options
23%
RSU 24%
Cash LTIP
27%
Base
10%
Performance-
Based
Annual
Incentive
21%
Stock
Options
16%
RSU 22%
Cash LTIP
15% Base 26%
Performance-
Based
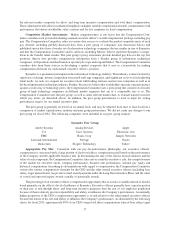
Further, the following charts illustrate the compensation pay mixes of our NEOs’ fiscal 2012 target total direct
compensation which includes performance-based restricted stock units (as described further below). Notably, the
proportion of at-risk pay to total pay for our NEOs will increase from fiscal 2011 to fiscal 2012.
FY12 CEO Target Direct Compensation
Mix
FY12 All Other NEOs Average Target
Direct Compensation Mix
Cash LTIP
22%
RSU 18%
Annual
Incentive
13%
PRU* 38%
Base
9%
Performance-
Based
Annual
Incentive
14%
PRU* 30%
RSU 27%
Cash LTIP
16%
Base
13%
Performance-
Based
* The values of PRU grants were calculated using the grant date fair value.
The Compensation Committee, in consultation with Mercer, has conducted a risk analysis on Symantec’s
compensation policies and practices, and does not believe that our compensation programs encourage excessive or
inappropriate risk taking by our executives or are reasonably likely to have a material adverse effect on the
Company.
Form and Mix of Long-Term Equity Incentive Compensation: We have used two forms of equity for
long-term equity incentive compensation in the last several years: stock options and restricted stock units. (See
“Equity Incentive Awards” below for more information regarding the specific features of each form). For fiscal
2011, the named executive officers, other than the CEO, received approximately 57% of the value of their equity
compensation in the form of restricted stock units and 43% in the form of stock options, while the CEO received
38