Symantec 2011 Annual Report Download - page 94
Download and view the complete annual report
Please find page 94 of the 2011 Symantec annual report below. You can navigate through the pages in the report by either clicking on the pages listed below, or by using the keyword search tool below to find specific information within the annual report.-
 1
1 -
2
-
3
-
4
-
5
-
6
-
7
-
8
-
9
-
10
-
11
-
12
-
13
-
14
-
15
-
16
-
17
-
18
-
19
-
20
-
21
-
22
-
23
-
24
-
25
-
26
-
27
-
28
-
29
-
30
-
31
-
32
-
33
-
34
-
35
-
36
-
37
-
38
-
39
-
40
-
41
-
42
-
43
-
44
-
45
-
46
-
47
-
48
-
49
-
50
-
51
-
52
-
53
-
54
-
55
-
56
-
57
-
58
-
59
-
60
-
61
-
62
-
63
-
64
-
65
-
66
-
67
-
68
-
69
-
70
-
71
-
72
-
73
-
74
-
75
-
76
-
77
-
78
-
79
-
80
-
81
-
82
-
83
-
 84
84 -
 85
85 -
 86
86 -
 87
87 -
 88
88 -
 89
89 -
 90
90 -
 91
91 -
 92
92 -
 93
93 -
 94
94 -
 95
95 -
 96
96 -
 97
97 -
 98
98 -
 99
99 -
 100
100 -
 101
101 -
 102
102 -
 103
103 -
 104
104 -
105
-
106
-
107
-
108
-
109
-
110
-
111
-
112
-
113
-
114
-
115
-
116
-
117
-
118
-
119
-
120
-
121
-
122
-
123
-
124
-
125
-
126
-
127
-
128
-
129
-
130
-
131
-
132
-
133
-
134
-
135
-
136
-
137
-
138
-
139
-
140
-
141
-
142
-
143
-
144
-
145
-
146
-
147
-
148
-
149
-
150
-
151
-
152
-
153
-
154
-
155
-
156
-
157
-
158
-
159
-
160
-
161
-
162
-
163
-
164
-
165
-
166
-
167
-
168
-
169
-
170
-
171
-
172
-
173
-
174
-
175
-
176
-
177
-
178
 |
 |

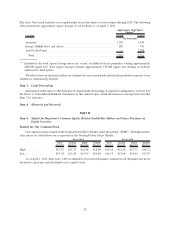
Bay Area. Our leased facilities are occupied under leases that expire at various times through 2029. The following
table presents the approximate square footage of our facilities as of April 1, 2011:
Location Owned Leased
Approximate Total Square
Footage
(1)
(In thousands)
Americas ................................................. 1,750 1,445
Europe, Middle East, and Africa ................................ 285 730
Asia Pacific/Japan .......................................... — 1,336
Total .................................................. 2,035 3,511
(1)
Included in the total square footage above are vacant, available-for-lease properties totaling approximately
400,000 square feet. Total square footage excludes approximately 159,000 square feet relating to facilities
subleased to third parties.
We believe that our existing facilities are adequate for our current needs and that the productive capacity of our
facilities is substantially utilized.
Item 3. Legal Proceedings
Information with respect to this Item may be found under the heading “Litigation Contingencies” in Note 8 of
the Notes to Consolidated Financial Statements in this annual report which information is incorporated into this
Item 3 by reference.
Item 4. (Removed and Reserved)
PART II
Item 5. Market for Registrant’s Common Equity, Related Stockholder Matters and Issuer Purchases of
Equity Securities
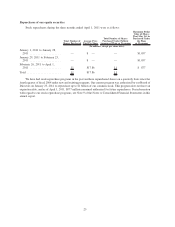
Market for Our Common Stock
Our common stock is traded on the Nasdaq Global Select Market under the symbol “SYMC.” The high and low
sales prices set forth below are as reported on the Nasdaq Global Select Market.
First
Quarter
Second
Quarter
Third
Quarter
Fourth
Quarter
First
Quarter
Second
Quarter
Third
Quarter
Fourth
Quarter
Fiscal 2011 Fiscal 2010
High ................. $17.47 $15.75 $18.24 $18.80 $19.16 $18.28 $17.71 $18.17
Low.................. $13.58 $12.04 $14.76 $16.84 $16.13 $15.68 $14.65 $13.97
As of April 1, 2011, there were 2,405 stockholders of record of Symantec common stock. Symantec has never
declared or paid any cash dividends on its capital stock.
24