Symantec 2011 Annual Report Download - page 43
Download and view the complete annual report
Please find page 43 of the 2011 Symantec annual report below. You can navigate through the pages in the report by either clicking on the pages listed below, or by using the keyword search tool below to find specific information within the annual report.-
 1
1 -
2
-
3
-
4
-
5
-
6
-
7
-
8
-
9
-
10
-
11
-
12
-
13
-
14
-
15
-
16
-
17
-
18
-
19
-
20
-
21
-
22
-
23
-
24
-
25
-
26
-
27
-
28
-
29
-
30
-
31
-
32
-
 33
33 -
 34
34 -
 35
35 -
 36
36 -
 37
37 -
 38
38 -
 39
39 -
 40
40 -
 41
41 -
 42
42 -
 43
43 -
 44
44 -
 45
45 -
 46
46 -
 47
47 -
 48
48 -
 49
49 -
 50
50 -
 51
51 -
 52
52 -
 53
53 -
54
-
55
-
56
-
57
-
58
-
59
-
60
-
61
-
62
-
63
-
64
-
65
-
66
-
67
-
68
-
69
-
70
-
71
-
72
-
73
-
74
-
75
-
76
-
77
-
78
-
79
-
80
-
81
-
82
-
83
-
84
-
85
-
86
-
87
-
88
-
89
-
90
-
91
-
92
-
93
-
94
-
95
-
96
-
97
-
98
-
99
-
100
-
101
-
102
-
103
-
104
-
105
-
106
-
107
-
108
-
109
-
110
-
111
-
112
-
113
-
114
-
115
-
116
-
117
-
118
-
119
-
120
-
121
-
122
-
123
-
124
-
125
-
126
-
127
-
128
-
129
-
130
-
131
-
132
-
133
-
134
-
135
-
136
-
137
-
138
-
139
-
140
-
141
-
142
-
143
-
144
-
145
-
146
-
147
-
148
-
149
-
150
-
151
-
152
-
153
-
154
-
155
-
156
-
157
-
158
-
159
-
160
-
161
-
162
-
163
-
164
-
165
-
166
-
167
-
168
-
169
-
170
-
171
-
172
-
173
-
174
-
175
-
176
-
177
-
178
 |
 |

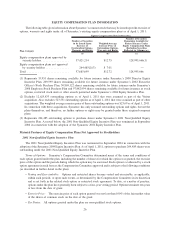
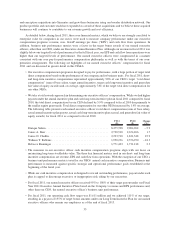
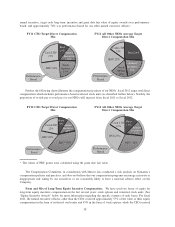
• For fiscal 2011, the named executive officers other than the CEO received, on average, 57% of the value of
their equity compensation in the form of restricted stock units and 43% in stock options, while the CEO
received 50% of the value of his equity compensation in the form of stock options and 50% in the form of
restricted stock units.
The following are highlights of changes that we have implemented in our executive compensation program for
fiscal 2012:
• We will cease granting stock options as a part of the annual equity compensation component of the
compensation program for our named executive officers. We will continue to grant restricted stock units and
will replace stock options with performance-based restricted stock units using earnings per share and relative
total stockholder return as performance measures, two metrics strongly tied to long-term stockholder value
creation. As a result, approximately 68% of the value of our CEO’s fiscal 2012 equity compensation is in the
form of performance-based restricted stock units and approximately 32% is in the form of time-based
restricted stock units.
• Consistent with prevailing market practices in our industry, beginning in fiscal 2012, we are shifting our base
salary position strategy from targeting the 65th percentile of the relevant market composite to the
50th percentile of the relevant market composite, maintaining target total cash compensation positioning
at market 65th percentile, and shifting our long-term incentive compensation position strategy from
50th percentile of the relevant market composite to 65th percentile of the relevant market composite.
As this shift is implemented, these adjustments will allow for enhanced emphasis on higher variable
compensation rewards commensurate with performance that drives stockholder value creation and less
emphasis on fixed compensation.
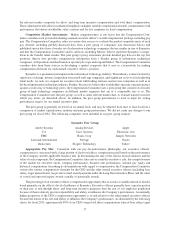
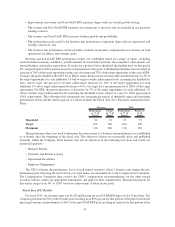
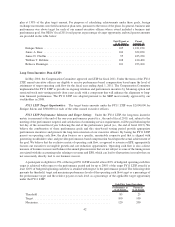
Relationship Between Company Performance and CEO Compensation
The following charts illustrate the relationship between our CEO’s total compensation (as shown in the
Summary Compensation Table on page 50) and the three key financial metrics used in his incentive compensation.
CEO Total Pay vs. Non-GAAP EPS*
$10,000 $2.00
$1.50
$1.00
$0.50
$0.00
$8,000
$6,000
$4,000
$2,000
$0
CEO Total Pay in Millions
Non-GAAP EPS
FY 2010
Total Compensation Non-GAAP EPS
FY 2011
34