Symantec 2011 Annual Report Download - page 108
Download and view the complete annual report
Please find page 108 of the 2011 Symantec annual report below. You can navigate through the pages in the report by either clicking on the pages listed below, or by using the keyword search tool below to find specific information within the annual report.-
 1
1 -
2
-
3
-
4
-
5
-
6
-
7
-
8
-
9
-
10
-
11
-
12
-
13
-
14
-
15
-
16
-
17
-
18
-
19
-
20
-
21
-
22
-
23
-
24
-
25
-
26
-
27
-
28
-
29
-
30
-
31
-
32
-
33
-
34
-
35
-
36
-
37
-
38
-
39
-
40
-
41
-
42
-
43
-
44
-
45
-
46
-
47
-
48
-
49
-
50
-
51
-
52
-
53
-
54
-
55
-
56
-
57
-
58
-
59
-
60
-
61
-
62
-
63
-
64
-
65
-
66
-
67
-
68
-
69
-
70
-
71
-
72
-
73
-
74
-
75
-
76
-
77
-
78
-
79
-
80
-
81
-
82
-
83
-
84
-
85
-
86
-
87
-
88
-
89
-
90
-
91
-
92
-
93
-
94
-
95
-
96
-
97
-
 98
98 -
 99
99 -
 100
100 -
 101
101 -
 102
102 -
 103
103 -
 104
104 -
 105
105 -
 106
106 -
 107
107 -
 108
108 -
 109
109 -
 110
110 -
 111
111 -
 112
112 -
 113
113 -
 114
114 -
 115
115 -
 116
116 -
 117
117 -
 118
118 -
119
-
120
-
121
-
122
-
123
-
124
-
125
-
126
-
127
-
128
-
129
-
130
-
131
-
132
-
133
-
134
-
135
-
136
-
137
-
138
-
139
-
140
-
141
-
142
-
143
-
144
-
145
-
146
-
147
-
148
-
149
-
150
-
151
-
152
-
153
-
154
-
155
-
156
-
157
-
158
-
159
-
160
-
161
-
162
-
163
-
164
-
165
-
166
-
167
-
168
-
169
-
170
-
171
-
172
-
173
-
174
-
175
-
176
-
177
-
178
 |
 |

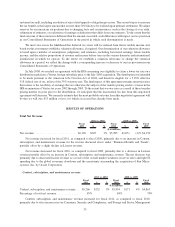
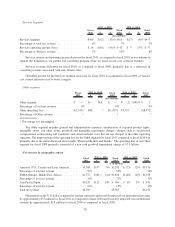
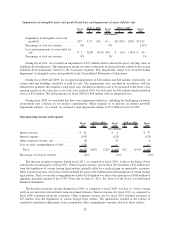
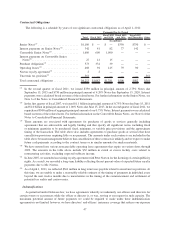
Services Segment
Fiscal
2011 $ %
Fiscal
2010 $ %
Fiscal
2009
2011 vs. 2010 2010 vs. 2009
($ in millions)
Services segment . . . . . . . . . . . . . . . . . . . . . . . . . . . . . $364 $(52) (13)% $416 $(17) (4)% $433
Percentage of total net revenue. . . . . . . . . . . . . . . . . . . 6% 7% 7%
Services operating income (loss) . . . . . . . . . . . . . . . . . $ 24 $(18) (43)% $ 42 $ 9 27% $ 33
Percentage of Services revenue . . . . . . . . . . . . . . . . . . 7% 10% 8%
Services revenue and operating income decreased for fiscal 2011, as compared to fiscal 2010, as we continue to
support the transition to our partner led consulting program while we focus on our core software business.
Services revenue decreased for fiscal 2010, as compared to fiscal 2009, primarily due to a reduction in
consulting revenue associated with new license sales.
Operating income for the Services segment increased for fiscal 2010, as compared to fiscal 2009, as various
cost control initiatives led to better margins.
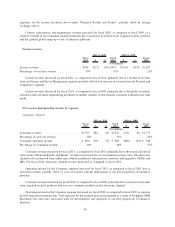
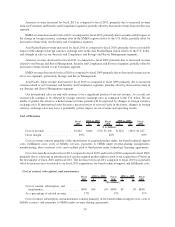
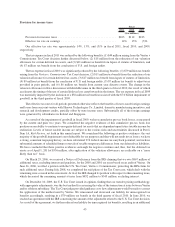
Other segment
Fiscal
2011 $ %
Fiscal
2010 $ %
Fiscal
2009
2011 vs. 2010 2010 vs. 2009
($ in millions)
Other segment...................... $ — $— NA $ — $ (1) (100)% $ 1
Percentage of total net revenue ......... 0% 0% 0%
Other operating loss ................. $(1,349) $88 * $(1,437) $7,535 * $(8,972)
Percentage of Other revenue ........... * * *
* Percentage not meaningful
The Other segment includes general and administrative expenses; amortization of acquired product rights,
intangible assets, and other assets; goodwill and intangible impairment charges; charges such as stock-based
compensation, restructuring and transition; and certain indirect costs that are not charged to the other operating
segments. The improvement of the operating loss for the Other segment for fiscal 2011 compared to fiscal 2010 was
primarily due to the items discussed above under “Financial Results and Trends.” The operating loss of our Other
segment for fiscal 2009 primarily consisted of a non-cash goodwill impairment charge of $7.4 billion.
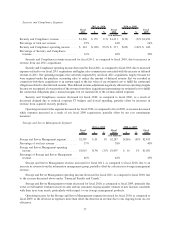
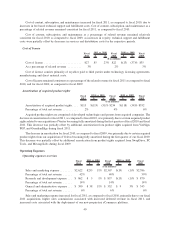
Net revenue by geographic region
Fiscal
2011 $ %
Fiscal
2010 $ %
Fiscal
2009
2011 vs. 2010 2010 vs. 2009
($ in millions)
Americas (U.S., Canada and Latin America) ....... $3,388 $147 5% $3,241 $ (75) (2)% $3,316
Percentage of total net revenue................. 55% 54% 54%
EMEA (Europe, Middle East, Africa) ............ $1,773 $ (65) (4)% $1,838 $(120) (6)% $1,958
Percentage of total net revenue................. 29% 31% 32%
Asia Pacific/Japan . . ........................ $1,029 $123 14% $ 906 $ 30 3% $ 876
Percentage of total net revenue................. 16% 15% 14%
Total net revenue . . ........................ $6,190 $5,985 $6,150
Fluctuations in the U.S. dollar compared to foreign currencies unfavorably impacted our international revenue
by approximately $53 million for fiscal 2011 as compared to fiscal 2010 and favorably impacted our international
revenue by approximately $14 million for fiscal 2010 as compared to fiscal 2009.
38