Symantec 2011 Annual Report Download - page 50
Download and view the complete annual report
Please find page 50 of the 2011 Symantec annual report below. You can navigate through the pages in the report by either clicking on the pages listed below, or by using the keyword search tool below to find specific information within the annual report.-
 1
1 -
2
-
3
-
4
-
5
-
6
-
7
-
8
-
9
-
10
-
11
-
12
-
13
-
14
-
15
-
16
-
17
-
18
-
19
-
20
-
21
-
22
-
23
-
24
-
25
-
26
-
27
-
28
-
29
-
30
-
31
-
32
-
33
-
34
-
35
-
36
-
37
-
38
-
39
-
 40
40 -
 41
41 -
 42
42 -
 43
43 -
 44
44 -
 45
45 -
 46
46 -
 47
47 -
 48
48 -
 49
49 -
 50
50 -
 51
51 -
 52
52 -
 53
53 -
 54
54 -
 55
55 -
 56
56 -
 57
57 -
 58
58 -
 59
59 -
 60
60 -
61
-
62
-
63
-
64
-
65
-
66
-
67
-
68
-
69
-
70
-
71
-
72
-
73
-
74
-
75
-
76
-
77
-
78
-
79
-
80
-
81
-
82
-
83
-
84
-
85
-
86
-
87
-
88
-
89
-
90
-
91
-
92
-
93
-
94
-
95
-
96
-
97
-
98
-
99
-
100
-
101
-
102
-
103
-
104
-
105
-
106
-
107
-
108
-
109
-
110
-
111
-
112
-
113
-
114
-
115
-
116
-
117
-
118
-
119
-
120
-
121
-
122
-
123
-
124
-
125
-
126
-
127
-
128
-
129
-
130
-
131
-
132
-
133
-
134
-
135
-
136
-
137
-
138
-
139
-
140
-
141
-
142
-
143
-
144
-
145
-
146
-
147
-
148
-
149
-
150
-
151
-
152
-
153
-
154
-
155
-
156
-
157
-
158
-
159
-
160
-
161
-
162
-
163
-
164
-
165
-
166
-
167
-
168
-
169
-
170
-
171
-
172
-
173
-
174
-
175
-
176
-
177
-
178
 |
 |

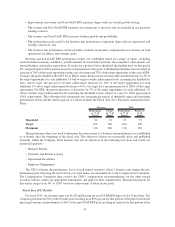
• Improvement in revenue and Non-GAAP EPS measures aligns with our overall growth strategy;
• The revenue and Non-GAAP EPS measures are transparent to investors and are included in our quarterly
earnings releases;
• The revenue and Non-GAAP EPS measures balance growth and profitability;
• The performance goals used for the business unit performance component align with our operational and
strategic objectives; and
• The business unit performance metric provides a balance in incentive compensation as it focuses on both
operational excellence and strategic goals.
Revenue and non-GAAP EPS performance targets are established based on a range of inputs, including
external market economic conditions, growth outlooks for our product portfolio, the competitive environment, our
internal budgets, and market expectations. If results for a goal are below threshold, the funding level for that goal is
0%, and participants will be paid no incentive compensation for that goal. A threshold performance level resulted in
a payout of 70% of the target opportunity in the case of revenue and 75% of the target opportunity in the case of EPS.
At target, the goal is funded at the 100% level. Below target, the payout for revenue achievement decreases by 5% of
the target opportunity for each additional 1% below target revenue achievement levels (assuming the threshold is
met). Above target, the payout for revenue achievement increases by 10% of the target opportunity for each
additional 1% above target achievement levels up to 10% over target for a maximum payout of 200% of the target
opportunity. For EPS, the payout increases or decreases by 5% of the target opportunity for each additional 1%
above or below target achievement levels (assuming the threshold is met), subject to a cap of a 150% payout upon
110% achievement. The following table summarizes the foregoing discussion of threshold, target and maximum
performance levels and the relative payout at each level under the Fiscal Year 2011 Executive Annual Incentive
Plans:
Performance
as % of
Target
Payout
as % of
Target
Performance
as % of
Target
Payout as
%of
Target
Revenue EPS
Threshold............................... 94 70 95 75
Target ................................. 100 100 100 100
Maximum .............................. 110 200 110 150
The performance objectives used to determine the achievement of a business unit performance are established
at or shortly after the beginning of the fiscal year. The objectives chosen are measurable goals and published
internally within the Company. Each business unit sets its objectives in the following four areas and results are
monitored quarterly:
• Business Results
• Customer and Partner Loyalty
• Operational Excellence
• Employee Engagement
The CEO evaluates the performance level of each named executive officer’s business unit against the pre-
determined goals following the end of fiscal year, then makes recommendations to the Compensation Committee.
The Compensation Committee then reviews the CEO’s compensation recommendations for the other named
executive officers, makes any appropriate adjustments, and approves their compensation. The potential payout for
this metric ranges from 0% to 150% based on achievement of these preset goals.
Fiscal Year 2011 Results
For fiscal 2011, our revenue target was $6,325 million and our non-GAAP EPS target was $1.35 per share. The
Company performed at 96% of the revenue goal, resulting in an 80% payout for that portion of the plan based on the
plan target amount, and performed at 106% of the non-GAAP EPS goal, resulting in a payout for that portion of the
41