Symantec 2011 Annual Report Download - page 163
Download and view the complete annual report
Please find page 163 of the 2011 Symantec annual report below. You can navigate through the pages in the report by either clicking on the pages listed below, or by using the keyword search tool below to find specific information within the annual report.-
 1
1 -
2
-
3
-
4
-
5
-
6
-
7
-
8
-
9
-
10
-
11
-
12
-
13
-
14
-
15
-
16
-
17
-
18
-
19
-
20
-
21
-
22
-
23
-
24
-
25
-
26
-
27
-
28
-
29
-
30
-
31
-
32
-
33
-
34
-
35
-
36
-
37
-
38
-
39
-
40
-
41
-
42
-
43
-
44
-
45
-
46
-
47
-
48
-
49
-
50
-
51
-
52
-
53
-
54
-
55
-
56
-
57
-
58
-
59
-
60
-
61
-
62
-
63
-
64
-
65
-
66
-
67
-
68
-
69
-
70
-
71
-
72
-
73
-
74
-
75
-
76
-
77
-
78
-
79
-
80
-
81
-
82
-
83
-
84
-
85
-
86
-
87
-
88
-
89
-
90
-
91
-
92
-
93
-
94
-
95
-
96
-
97
-
98
-
99
-
100
-
101
-
102
-
103
-
104
-
105
-
106
-
107
-
108
-
109
-
110
-
111
-
112
-
113
-
114
-
115
-
116
-
117
-
118
-
119
-
120
-
121
-
122
-
123
-
124
-
125
-
126
-
127
-
128
-
129
-
130
-
131
-
132
-
133
-
134
-
135
-
136
-
137
-
138
-
139
-
140
-
141
-
142
-
143
-
144
-
145
-
146
-
147
-
148
-
149
-
150
-
151
-
152
-
 153
153 -
 154
154 -
 155
155 -
 156
156 -
 157
157 -
 158
158 -
 159
159 -
 160
160 -
 161
161 -
 162
162 -
 163
163 -
 164
164 -
 165
165 -
 166
166 -
 167
167 -
 168
168 -
 169
169 -
 170
170 -
 171
171 -
 172
172 -
 173
173 -
174
-
175
-
176
-
177
-
178
 |
 |

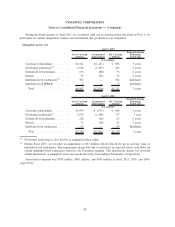
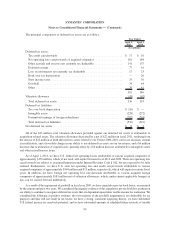
Product Revenue Information
April 1,
2011
April 2,
2010
April 3,
2009
Year Ended
Product revenue:
Core consumer security .................................... 28% 28% 27%
Backup ................................................ 21% 20% 20%
Storage and availability management .......................... 10% 11% 12%
Endpoint security and management ............................ 10% 10% 11%
Others
(1)
............................................... 31% 31% 30%
100% 100% 100%
(1)
No individual product was material to the respective total.
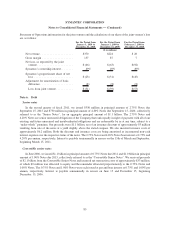
Geographical Information
The following table represents revenue amounts reported for products shipped to customers in the corre-
sponding countries:
April 1,
2011
April 2,
2010
April 3,
2009
Year Ended
(In millions)
Net revenue:
United States ........................................... $3,056 $2,967 $3,024
United Kingdom ......................................... 599 642 685
Other foreign countries
(1)
.................................. 2,535 2,376 2,441
$6,190 $5,985 $6,150
(1)
No individual country represented more than 10% of the respective totals.
The table below lists our property and equipment, net of accumulated depreciation, by geographic area. With
the exception of property and equipment, we do not identify or allocate our assets by geographic area:
April 1,
2011
April 2,
2010
Year Ended
(In millions)
Long-lived assets:
United States ................................................... $ 835 $782
Foreign countries
(1)
............................................... 215 167
$1,050 $949
(1)
No individual country represented more than 10% of the respective totals.
Significant customers
In fiscal 2011 and 2010 one distributor, Ingram Micro, accounted for 10% of our total net revenue in both
periods. Our distributor arrangements with Ingram Micro consist of several non-exclusive, independently
93
SYMANTEC CORPORATION
Notes to Consolidated Financial Statements — (Continued)